Denison High School
Rating
Not Available
Not Available

2.5 out of 5 | 3 Reviews
Find Old Friends From Denison High School
Use the form below to search for alumni from Denison High School.
School Description
School Summary and Highlights
- Enrolls 1,310 high school students from grades 9-12
- Ranks 286th out of 1,325 high schools in TX.
- 2010 Overall School AYP Met Status: Yes
Additional Contact Information
- Mailing Address: 1901 S Mirick Ave, Denison, TX 75020
- Principal or Admin: Dr Cavin Boettger
- Fax: (903) 462-7217
- Website: denisonisd.net
School Operational Details
- Title I EligibleAll students of this school are eligible for participation in authorized programs.
School District Details
- Denison Independent School District (ISD)
- Per-Pupil Spending: $8,223
- Graduation Rate: 73.0%
- Dropout Rate: 2.1%
- Students Per Teacher: 13.5
- Enrolled Students: 4,492
Faculty Details and Student Enrollment
Students and Faculty
- Total Students Enrolled: 1,310
- Total Full Time "Equivalent" Teachers: 96.9
- Average Student-To-Teacher Ratio: 13.5
Students Gender Breakdown
- Males: 687 (52.4%)
- Females: 623 (47.6%)
Free Lunch Student Eligibility Breakdown
- Eligible for Reduced Lunch: 146 (11.1%)
- Eligible for Free Lunch: 501 (38.2%)
- Eligible for Either Reduced or Free Lunch: 647 (49.4%)
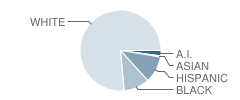
Student Enrollment Distribution by Race / Ethnicity
| Number | Percent | |
|---|---|---|
| American Indian | 28 | 2.1% |
| Black | 135 | 10.3% |
| Asian | 6 | 0.5% |
| Hispanic | 140 | 10.7% |
| White | 1,001 | 76.4% |
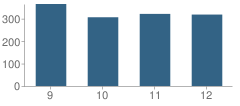
Number of Students Per Grade
| Number | Percent | |
|---|---|---|
| 9th Grade | 365 | 27.9% |
| 10th Grade | 306 | 23.4% |
| 11th Grade | 321 | 24.5% |
| 12th Grade | 318 | 24.3% |
Breakdown of College Ready Graduates (2009)
Percent Ready For College in Reading
School:
73.0%
District:
71.0%
State:
62.0%
Percent Ready For College in Math
School:
65.0%
District:
46.0%
State:
60.0%
Graduation & Dropout Rates (2009)
Graduation Rate
School:
85.5%
District:
84.9%
State:
80.6%
Dropout Rate
School:
6.2%
District:
5.9%
State:
9.4%
Faculty Breakdown (2010)
Average Teacher Experience
School:
14.0
District:
13.8
State:
11.3
Percent of Teachers With 1-5 Years Experience
School:
18.3%
District:
23.1%
State:
31.0%
Percent of Teachers With 6-10 Years Experience
School:
29.9%
District:
21.8%
State:
20.3%
Percent of Teachers With 11-20 Years Experience
School:
25.4%
District:
28.1%
State:
24.4%
Percent of Teachers With Greater Than 20 Years Experience
School:
24.4%
District:
24.8%
State:
18.3%
Faculty Salary (2010)
School Administration Average Base Salary
School:
$54,248
District:
$67,786
State:
$70,209
Teacher Average Base Salary
School:
$47,748
District:
$46,483
State:
$48,263
Beginning Teacher Average Base Salary
School:
$40,250
District:
$41,139
State:
$41,165
Teacher With 1-5 Years Experience Average Base Salary
School:
$42,089
State:
$43,527
Teacher With 6-10 Years Experience Average Base Salary
School:
$43,827
State:
$46,149
Teacher With 11-20 Years Experience Average Base Salary
School:
$48,621
State:
$50,153
Teacher With Greater Than 20 Years Experience Average Base Salary
School:
$56,532
State:
$58,427
Source: TX Department of Education, Source: NCES 2009-2010
School Ratings and Reviews
Overall Rating: 2.5

2.5 out of 5 | 3 Reviews
The Overall Rating is the school's average rating from parents, students, school faculty and staff. The highest rating is five apples and the lowest is one apple.
Share Your Review About This School
3 reviews for Denison High School
- Reviewed by Parent or Guardian on November 24, 2010
- Rating:
 (5 / 5) Flag as inappropriate
 - Great school! Newsweek's Top 4%! Great test results and great teachers! Producing great students who leave with the education to be successful in the future
- Reviewed by Former Student on August 10, 2009
- Rating:
 (1 / 5) Flag as inappropriate
 - Arrogant administration with little control. They are too focused on state tests and not on actually teaching the students useful information.
- Reviewed by Parent/Guardian on February 24, 2009
- Rating: (1 / 5) Flag as inappropriate
- Crowded school with barely any control over students. Students have horrible manners
School Map and Similar Schools Nearby
Click to Activate Map of Nearby School Campuses
Private
Public
This School
Similar Schools Nearby
| Pottsboro High School 9-12 | 329 Students | 6.9 miles away | Not Yet Rated | |
| Sherman High School 9-12 | 1,609 Students | 6.9 miles away | Not Yet Rated | |
| Pritchard Junior High School 6-8 | 167 Students | 10.9 miles away | Not Yet Rated | |
| Bells High School 9-12 | 238 Students | 10.9 miles away | Not Yet Rated | |
| Savoy High School 7-12 | 156 Students | 13.7 miles away |  5 out of 5 | |
| Tom Bean High School 9-12 | 267 Students | 14.7 miles away | Not Yet Rated | |
| Howe High School 9-12 | 295 Students | 14.9 miles away | Not Yet Rated | |
| Whitewright High School 9-12 | 236 Students | 18.2 miles away | Not Yet Rated | |
| Ector High School 7-12 | 119 Students | 19.2 miles away | Not Yet Rated | |
| Van Alstyne High School 9-12 | 445 Students | 20.8 miles away | 5 out of 5 | |
Compare This School To Nearby Schools ->
School Community Forum

Join a discussion about Denison High School and talk to others in the community including students, parents, teachers, and administrators.
Popular Discussion Topics
- Admissions and Registration Questions (e.g. Dress Code and Discipline Policy)
- School Calendar and Upcoming Events (e.g. Graduation)
- After School Programs, Extracurricular Activities, and Athletics (e.g. Football)
- News and Announcements (e.g. Yearbook and Class Supply List Details)
- Graduate and Alumni Events (e.g. Organizing Class Reunions)
Navigation
Can't Find What You Are Looking For?
Nearby Cities
Sponsored Links
K-12 Articles

Helping Young Children with Printing and Cursive Writing
Is your child experiencing difficulty printing or writing? Is he unable to print or write legibly,...
Is your child experiencing difficulty printing or writing? Is he unable to print or write legibly,...

Hurt: A Book Report
My last book report was over 15 years ago, and I'm a bit rusty, but here goes (Don't forget: book...
My last book report was over 15 years ago, and I'm a bit rusty, but here goes (Don't forget: book...

Halloween Safety Tips
Ghosts and witches sit beside mistletoe and tinsel on store shelves. Orange and black deck the...
Ghosts and witches sit beside mistletoe and tinsel on store shelves. Orange and black deck the...