Mount Miguel High School
Rating
Not Available
Not Available

5 out of 5 | 1 Review
Find Old Friends From Mount Miguel High School
Use the form below to search for alumni from Mount Miguel High School.
School Description
School Summary and Highlights
- Enrolls 1,901 high school students from grades 9-12
- Ranks 892nd out of 1,197 high schools in CA.
- 2010 Overall School AYP Met Status: No
Additional Contact Information
- Mailing Address: 8585 Blossom Ln., Spring Valley, CA 91977
School Operational Details
- Title I EligibleAll students of this school are eligible for participation in authorized programs.
School District Details
- Grossmont Union High School District
- Per-Pupil Spending: $9,467
- Dropout Rate: 2.8%
- Students Per Teacher: 26.1
- Enrolled Students: 25,352
Faculty Details and Student Enrollment
Students and Faculty
- Total Students Enrolled: 1,901
- Total Full Time "Equivalent" Teachers: 77.6
- Average Student-To-Teacher Ratio: 24.5
Students Gender Breakdown
- Males: 995 (52.3%)
- Females: 906 (47.7%)
Free Lunch Student Eligibility Breakdown
- Eligible for Reduced Lunch: 115 (6.0%)
- Eligible for Free Lunch: 873 (45.9%)
- Eligible for Either Reduced or Free Lunch: 988 (52.0%)
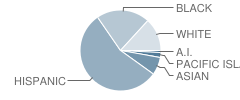
Student Enrollment Distribution by Race / Ethnicity
| Number | Percent | |
|---|---|---|
| American Indian | 21 | 1.1% |
| Black | 402 | 21.1% |
| Asian | 138 | 7.3% |
| Hispanic | 1,032 | 54.3% |
| White | 250 | 13.2% |
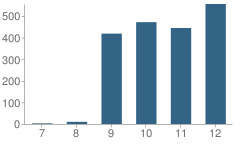
Number of Students Per Grade
| Number | Percent | |
|---|---|---|
| 7th Grade | 3 | 0.2% |
| 8th Grade | 10 | 0.5% |
| 9th Grade | 418 | 22.0% |
| 10th Grade | 471 | 24.8% |
| 11th Grade | 444 | 23.4% |
| 12th Grade | 555 | 29.2% |
Graduates Information (2010)
Graduation Rate
School:
74.8%
District:
82.0%
State:
78.6%
Teacher Education Background (2009)
Percent With Master's Degree
School:
10.0%
District:
16.7%
Percent With Bachelor's Degree
School:
63.3%
District:
70.8%
Teacher Credentials & Experience (2009)
Percent of Teachers With Credentials: 100.0%
Number of Certificated Staff: 90.0
Average Number of Years of Teacher Experience: 11.7
Average Age
School:
40.1
District:
46.0
Source: CA Department of Education, Source: NCES 2009-2010
School Ratings and Reviews
Overall Rating: 5

5 out of 5 | 1 Review
The Overall Rating is the school's average rating from parents, students, school faculty and staff. The highest rating is five apples and the lowest is one apple.
Share Your Review About This School
1 review for Mount Miguel High School
- Reviewed by Former Student on October 23, 2006
- Rating:
 (5 / 5) Flag as inappropriate
 - Mt. Miguel recieves a lot of criticism in the news and it is known as Mt. Mighetto by students from other schools and from it's own students as well. This is what I say to that, don't believe what you hear. Mt. Miguel is probably the best school to send your child to, there are teachers who care about not only your education, but your well being. Yes Mt. Miguel does not have the best test scores, or the best sport programs, but that is only because no one knows how great the school and staff actually is. For Example Last Friday I went to watch my friends younger brother play football and I was suprised to see the staff members still remember my name and the names of my closest friends. It's been five years since the last time I saw them and yet they still remembered us.
When I was a student at the Mount the teachers are the ones who made the difference. Their doors where always open and they knew when something was bothering one of us.
Till this day those who graduated from Mt. miguel in the class of 2001 will always have a close bond with each other as well as those from other gradutating years. For those who read this remember this: If a fellow graduate of the Mount calls you seeking a job, give them an interview, pick them up from the airport, invite them for lunch or dinner, we will always be Matadors.
Mount Miguel is the best school around, hands down.
School Map and Similar Schools Nearby
Click to Activate Map of Nearby School Campuses
Private
Public
This School
Similar Schools Nearby
| Monte Vista High School 9-12 | 2,096 Students | 2.7 miles away | Not Yet Rated | |
| Granger Junior High School 7-9 | 1,079 Students | 4.8 miles away |  3.5 out of 5 | |
| Bonita Vista High School 9-12 | 2,368 Students | 5.4 miles away | 3.5 out of 5 | |
| Eastlake High School 9-12 | 2,467 Students | 6.1 miles away | Not Yet Rated | |
| Sweetwater High School 9-12 | 2,456 Students | 6.2 miles away |  1 out of 5 | |
| Hilltop High School 9-12 | 2,318 Students | 6.5 miles away | Not Yet Rated | |
| Otay Ranch High School 9-12 | 2,705 Students | 7.6 miles away |  5 out of 5 | |
| Chula Vista High School 9-12 | 2,662 Students | 7.8 miles away | 5 out of 5 | |
| Castle Park High School 9-12 | 1,579 Students | 8.3 miles away | Not Yet Rated | |
| Olympian High School 9-12 | 1,565 Students | 8.8 miles away | Not Yet Rated | |
Compare This School To Nearby Schools ->
School Community Forum

Join a discussion about Mount Miguel High School and talk to others in the community including students, parents, teachers, and administrators.
Popular Discussion Topics
- Admissions and Registration Questions (e.g. Dress Code and Discipline Policy)
- School Calendar and Upcoming Events (e.g. Graduation)
- After School Programs, Extracurricular Activities, and Athletics (e.g. Football)
- News and Announcements (e.g. Yearbook and Class Supply List Details)
- Graduate and Alumni Events (e.g. Organizing Class Reunions)
Navigation
Can't Find What You Are Looking For?
Rankings
Nearby Cities
Sponsored Links
K-12 Articles

Helping Your Child Leave the Nest
It's all come down to this: Eighteen years of good times and bad, and now your baby bird is ready...
It's all come down to this: Eighteen years of good times and bad, and now your baby bird is ready...

Exciting School Lunch Ideas
Earlier this week I had reason to drop by my grandsons' school at lunch time. While waiting for the...
Earlier this week I had reason to drop by my grandsons' school at lunch time. While waiting for the...

Strategies to Help Kids Cope with Stress
Many parents believe that kids don't experience stress. Nothing could be further from the truth....
Many parents believe that kids don't experience stress. Nothing could be further from the truth....