Douglass School
Rating
Not Available
Not Available

No Reviews Yet
Find Old Friends From Douglass School
Use the form below to search for alumni from Douglass School.
School Description
School Summary and Highlights
- Enrolls 363 school students from grades PK-12
- Ranks 18th out of 1,325 high schools in TX.
- 2010 Overall School AYP Met Status: Yes
Additional Contact Information
- Mailing Address: P O Box 38, Douglass, TX 75943
- Principal or Admin: Mr Eric Bryan Samford
- Fax: (936) 569-9446
- Website: www.douglass.schoolfusion.us
School District Details
- Douglass Independent School District (ISD)
- Per-Pupil Spending: $7,627
- Graduation Rate: 67.9%
- Students Per Teacher: 11.0
- Enrolled Students: 363
Faculty Details and Student Enrollment
Students and Faculty
- Total Students Enrolled: 363
- Total Full Time "Equivalent" Teachers: 33.0
- Average Student-To-Teacher Ratio: 11.0
Students Gender Breakdown
- Males: 209 (57.6%)
- Females: 154 (42.4%)
Free Lunch Student Eligibility Breakdown
- Eligible for Reduced Lunch: 20 (5.5%)
- Eligible for Free Lunch: 102 (28.1%)
- Eligible for Either Reduced or Free Lunch: 122 (33.6%)
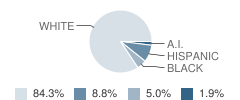
Student Enrollment Distribution by Race / Ethnicity
| Number | Percent | |
|---|---|---|
| American Indian | 7 | 1.9% |
| Black | 18 | 5.0% |
| Asian | - | - |
| Hispanic | 32 | 8.8% |
| White | 306 | 84.3% |
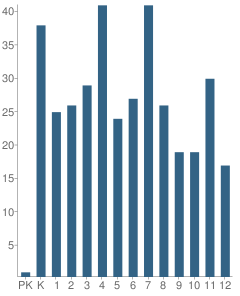
Number of Students Per Grade
| Number | Percent | |
|---|---|---|
| Pre-Kindergarten | 1 | 0.3% |
| Kindergarten | 38 | 10.5% |
| 1st Grade | 25 | 6.9% |
| 2nd Grade | 26 | 7.2% |
| 3rd Grade | 29 | 8.0% |
| 4th Grade | 41 | 11.3% |
| 5th Grade | 24 | 6.6% |
| 6th Grade | 27 | 7.4% |
| 7th Grade | 41 | 11.3% |
| 8th Grade | 26 | 7.2% |
| 9th Grade | 19 | 5.2% |
| 10th Grade | 19 | 5.2% |
| 11th Grade | 30 | 8.3% |
| 12th Grade | 17 | 4.7% |
Breakdown of College Ready Graduates (2009)
Percent Ready For College in Reading
School:
64.0%
District:
64.0%
State:
62.0%
Percent Ready For College in Math
School:
76.0%
State:
60.0%
Graduation & Dropout Rates (2009)
Graduation Rate
School:
96.2%
District:
96.2%
State:
80.6%
Faculty Breakdown (2010)
Average Teacher Experience
School:
12.8
District:
12.8
State:
11.3
Percent of Teachers With 1-5 Years Experience
School:
21.2%
District:
21.2%
State:
31.0%
Percent of Teachers With 6-10 Years Experience
School:
15.2%
District:
15.2%
State:
20.3%
Percent of Teachers With 11-20 Years Experience
School:
48.5%
District:
48.5%
State:
24.4%
Percent of Teachers With Greater Than 20 Years Experience
School:
12.1%
District:
12.1%
State:
18.3%
Faculty Salary (2010)
School Administration Average Base Salary
School:
$69,177
District:
$69,177
State:
$70,209
Teacher Average Base Salary
School:
$42,206
District:
$42,206
State:
$48,263
Beginning Teacher Average Base Salary
School:
$31,404
District:
$31,404
State:
$41,165
Teacher With 1-5 Years Experience Average Base Salary
School:
$35,608
State:
$43,527
Teacher With 6-10 Years Experience Average Base Salary
School:
$39,021
State:
$46,149
Teacher With 11-20 Years Experience Average Base Salary
School:
$45,135
State:
$50,153
Teacher With Greater Than 20 Years Experience Average Base Salary
School:
$48,716
State:
$58,427
Source: TX Department of Education, Source: NCES 2009-2010
School Ratings and Reviews
Be The First To Review Douglass School!
School Map and Similar Schools Nearby
Click to Activate Map of Nearby School Campuses
Private
Public
This School
Similar Schools Nearby
| Cushing School 6-12 | 285 Students | 10.9 miles away | Not Yet Rated | |
| Alto High School 9-12 | 181 Students | 11.2 miles away |  5 out of 5 | |
| Wells High School 9-12 | 91 Students | 12.8 miles away |  3 out of 5 | |
| Rusk High School 9-12 | 557 Students | 16.9 miles away | Not Yet Rated | |
| Central Junior High School 6-8 | 354 Students | 17.0 miles away | Not Yet Rated | |
| State School 9-12 | 2 Students | 17.0 miles away | Not Yet Rated | - |
| Rusk Junior High School 6-8 | 474 Students | 18.3 miles away | Not Yet Rated | |
| Mt Enterprise High School 6-12 | 213 Students | 21.0 miles away | Not Yet Rated | |
| Laneville School PK-12 | 182 Students | 21.6 miles away | Not Yet Rated | |
| Woden Junior High School 6-8 | 164 Students | 23.7 miles away | Not Yet Rated | |
Compare This School To Nearby Schools ->
School Community Forum

Join a discussion about Douglass School and talk to others in the community including students, parents, teachers, and administrators.
Popular Discussion Topics
- Admissions and Registration Questions (e.g. Dress Code and Discipline Policy)
- School Calendar and Upcoming Events (e.g. Graduation)
- After School Programs, Extracurricular Activities, and Athletics (e.g. Football)
- News and Announcements (e.g. Yearbook and Class Supply List Details)
- Graduate and Alumni Events (e.g. Organizing Class Reunions)
Navigation
Can't Find What You Are Looking For?
Nearby Cities
Sponsored Links
K-12 Articles

Breakfast, Kids and Learning
For generations parents have been telling their kids that breakfast is the most important meal of...
For generations parents have been telling their kids that breakfast is the most important meal of...

Special Needs Education: Your Child, Your Rights
Many children today have special needs that make it difficult for them to learn. It's imperative...
Many children today have special needs that make it difficult for them to learn. It's imperative...

Keep Your Licensed Teen Safe This Summer
Every year hundreds of teenage drivers lose their lives in motor vehicle accidents. Statistics show...
Every year hundreds of teenage drivers lose their lives in motor vehicle accidents. Statistics show...