West Hills High School

5 out of 5 | 1 Review
Find Old Friends From West Hills High School
Use the form below to search for alumni from West Hills High School.
School Description
School Summary and Highlights
- Enrolls 2,161 high school students from grades 9-12
- Ranks 395th out of 1,197 high schools in CA.
- 2010 Overall School AYP Met Status: No
Additional Contact Information
- Mailing Address: 8756 Mast Blvd., Santee, CA 92071
School District Details
- Grossmont Union High School District
- Per-Pupil Spending: $9,467
- Dropout Rate: 2.8%
- Students Per Teacher: 26.1
- Enrolled Students: 25,352
Faculty Details and Student Enrollment
Students and Faculty
- Total Students Enrolled: 2,161
- Total Full Time "Equivalent" Teachers: 77.2
- Average Student-To-Teacher Ratio: 28.0
Students Gender Breakdown
- Males: 1,040 (48.1%)
- Females: 1,121 (51.9%)
Free Lunch Student Eligibility Breakdown
- Eligible for Reduced Lunch: 38 (1.8%)
- Eligible for Free Lunch: 332 (15.4%)
- Eligible for Either Reduced or Free Lunch: 370 (17.1%)
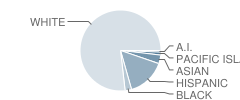
Student Enrollment Distribution by Race / Ethnicity

| Number | Percent | |
|---|---|---|
| American Indian | 19 | 0.9% |
| Black | 59 | 2.7% |
| Asian | 77 | 3.6% |
| Hispanic | 324 | 15.0% |
| White | 1,599 | 74.0% |
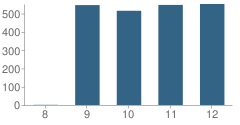
Number of Students Per Grade

| Number | Percent | |
|---|---|---|
| 8th Grade | 1 | 0.05% |
| 9th Grade | 546 | 25.3% |
| 10th Grade | 515 | 23.8% |
| 11th Grade | 547 | 25.3% |
| 12th Grade | 552 | 25.5% |
Graduates Information (2010)
Graduation Rate
School:
90.8%
District:
82.0%
State:
78.6%
Teacher Education Background (2009)
Percent With Master's Degree
School:
9.8%
District:
16.7%
Percent With Bachelor's Degree
School:
52.9%
District:
70.8%
Teacher Credentials & Experience (2009)
Percent of Teachers With Credentials: 100.0%
Number of Certificated Staff: 102.0
Average Number of Years of Teacher Experience: 14.1
Average Age
School:
39.5
District:
46.0
Source: CA Department of Education, Source: NCES 2009-2010
Sponsored Links
Test Scores and Performance Information
Overall School Rating
How is this determined?
The overall school rating shows that West Hills High School performed on average better than many other schools across the state on CST state exams in the following subjects:
- CST Algebra I
- CST Algebra II
- CST Biology
- CST Chemistry
- CST Earth Science
- CST English-Language Arts
- CST Geometry
- CST Integrated/Coordinated Science
- CST Physics
- CST Science
- CST Summative High School Math
- CST U.S. History
- CST World History
AYP Results (2010)
Overall AYP Met: No
ELA AYP Met: No
Math AYP Met: No
ACT Exam Results (2009)
Percent of Students Taking ACT Exam: 18.2%
Average Combined Score: 23.4
Percent Scoring At or Above 21: 71.3%
SAT Exam Results (2009)
Percent of Students Taking SAT Exam: 38.7%
Average Combined Score: 1,562.3
Critical Reading Average: 518.1
Math Average: 537.6
Writing Average: 506.6
Percent Scoring At or Above 1500: 64.2%
CST - Test Proficiency by Grade and Subject
Grade 9 - % of students at or above proficiency
| School | District | State | |
|---|---|---|---|
| CST Algebra I Test | |||
| 2010 | 42.0% | 32.0% | 22.0% |
| 2009 | 35.0% | 33.0% | 21.0% |
| 2008 | 28.0% | 29.0% | 18.0% |
| CST Biology Test | |||
| 2010 | 75.0% | 75.0% | 55.0% |
| 2009 | 62.0% | 64.0% | 51.0% |
| 2008 | 81.0% | 73.0% | 52.0% |
| CST English-Language Arts Test | |||
| 2010 | 73.0% | 55.0% | 54.0% |
| 2009 | 60.0% | 52.0% | 50.0% |
| 2008 | 63.0% | 53.0% | 49.0% |
| CST Geometry Test | |||
| 2010 | 52.0% | 65.0% | 46.0% |
| 2009 | 60.0% | 68.0% | 47.0% |
| 2008 | 47.0% | 58.0% | 43.0% |
| CST Integrated/Coordinated Science Test | |||
| 2008 | 31.0% | 20.0% | 5.0% |
Grade 10 - % of students at or above proficiency
| School | District | State | |
|---|---|---|---|
| CST Algebra I Test | |||
| 2010 | 26.0% | 14.0% | 12.0% |
| 2009 | 7.0% | 14.0% | 11.0% |
| 2008 | 4.0% | 9.0% | 9.0% |
| CST Algebra II Test | |||
| 2010 | 37.0% | 50.0% | 40.0% |
| 2009 | 39.0% | 46.0% | 37.0% |
| 2008 | 18.0% | 36.0% | 36.0% |
| CST Biology Test | |||
| 2010 | 45.0% | 43.0% | 38.0% |
| 2009 | 50.0% | 38.0% | 34.0% |
| 2008 | 52.0% | 39.0% | 35.0% |
| CST Chemistry Test | |||
| 2010 | 63.0% | 49.0% | 47.0% |
| 2009 | 62.0% | 41.0% | 44.0% |
| 2008 | 51.0% | 39.0% | 41.0% |
| CST English-Language Arts Test | |||
| 2010 | 51.0% | 43.0% | 45.0% |
| 2009 | 53.0% | 43.0% | 44.0% |
| 2008 | 49.0% | 41.0% | 41.0% |
| CST Geometry Test | |||
| 2010 | 7.0% | 16.0% | 14.0% |
| 2009 | 8.0% | 17.0% | 14.0% |
| 2008 | 10.0% | 13.0% | 12.0% |
| CST Integrated/Coordinated Science Test | |||
| 2010 | 31.0% | 20.0% | 14.0% |
| CST Science Test | |||
| 2010 | 54.0% | 42.0% | 46.0% |
| 2009 | 61.0% | 45.0% | 44.0% |
| 2008 | 57.0% | 40.0% | 40.0% |
| CST World History Test | |||
| 2010 | 54.0% | 47.0% | 42.0% |
| 2009 | 48.0% | 40.0% | 38.0% |
| 2008 | 50.0% | 37.0% | 33.0% |
Grade 11 - % of students at or above proficiency
| School | District | State | |
|---|---|---|---|
| CST Algebra I Test | |||
| 2010 | 1.0% | 11.0% | 8.0% |
| 2009 | - | - | - |
| 2008 | 4.0% | 6.0% | 5.0% |
| CST Algebra II Test | |||
| 2010 | 8.0% | 16.0% | 14.0% |
| 2009 | 8.0% | 13.0% | 12.0% |
| 2008 | 3.0% | 9.0% | 11.0% |
| CST Biology Test | |||
| 2010 | 53.0% | 54.0% | 46.0% |
| 2009 | 37.0% | 44.0% | 41.0% |
| 2008 | 36.0% | 38.0% | 39.0% |
| CST Chemistry Test | |||
| 2010 | 43.0% | 34.0% | 30.0% |
| 2009 | 33.0% | 33.0% | 27.0% |
| 2008 | 35.0% | 26.0% | 25.0% |
| CST Earth Science Test | |||
| 2010 | 8.0% | 27.0% | 32.0% |
| 2009 | - | - | - |
| 2008 | 11.0% | 27.0% | 28.0% |
| CST English-Language Arts Test | |||
| 2010 | 52.0% | 41.0% | 42.0% |
| 2009 | 50.0% | 41.0% | 40.0% |
| 2008 | 42.0% | 37.0% | 37.0% |
| CST Integrated/Coordinated Science Test | |||
| 2010 | 22.0% | 18.0% | 8.0% |
| 2009 | - | - | - |
| 2008 | 5.0% | 6.0% | 10.0% |
| CST Physics Test | |||
| 2010 | 57.0% | 46.0% | 53.0% |
| 2009 | 52.0% | 43.0% | 50.0% |
| 2008 | 50.0% | 43.0% | 47.0% |
| CST Summative High School Math Test | |||
| 2010 | 47.0% | 49.0% | 50.0% |
| 2009 | 49.0% | 46.0% | 47.0% |
| 2008 | 36.0% | 40.0% | 43.0% |
| CST U.S. History Test | |||
| 2010 | 50.0% | 46.0% | 45.0% |
| 2009 | 55.0% | 47.0% | 44.0% |
| 2008 | 45.0% | 38.0% | 38.0% |
| CST Geometry Test | |||
| 2009 | 3.0% | 4.0% | 7.0% |
| 2008 | 2.0% | 4.0% | 6.0% |
| CST World History Test | |||
| 2008 | 27.0% | 9.0% | 9.0% |
End of Course - % of students at or above proficiency
| School | District | State | |
|---|---|---|---|
| CST Algebra I Test | |||
| 2010 | 35.0% | 26.0% | 31.0% |
| 2009 | 31.0% | 26.0% | 28.0% |
| 2008 | 23.0% | 21.0% | 25.0% |
| CST Algebra II Test | |||
| 2010 | 22.0% | 30.0% | 31.0% |
| 2009 | 21.0% | 26.0% | 28.0% |
| 2008 | 9.0% | 21.0% | 27.0% |
| CST Biology Test | |||
| 2010 | 53.0% | 51.0% | 46.0% |
| 2009 | 52.0% | 44.0% | 42.0% |
| 2008 | 54.0% | 45.0% | 42.0% |
| CST Chemistry Test | |||
| 2010 | 48.0% | 39.0% | 38.0% |
| 2009 | 35.0% | 36.0% | 36.0% |
| 2008 | 37.0% | 31.0% | 32.0% |
| CST Earth Science Test | |||
| 2010 | 7.0% | 31.0% | 33.0% |
| 2009 | - | - | - |
| 2008 | 10.0% | 28.0% | 28.0% |
| CST Geometry Test | |||
| 2010 | 22.0% | 25.0% | 27.0% |
| 2009 | 22.0% | 26.0% | 26.0% |
| 2008 | 19.0% | 22.0% | 24.0% |
| CST Integrated/Coordinated Science Test | |||
| 2010 | 23.0% | 26.0% | 16.0% |
| 2009 | - | - | - |
| 2008 | 10.0% | 15.0% | 11.0% |
| CST Physics Test | |||
| 2010 | 60.0% | 48.0% | 49.0% |
| 2009 | 54.0% | 47.0% | 46.0% |
| 2008 | 51.0% | 41.0% | 43.0% |
| CST Summative High School Math Test | |||
| 2010 | 47.0% | 49.0% | 54.0% |
| 2009 | 49.0% | 46.0% | 50.0% |
| 2008 | 36.0% | 42.0% | 47.0% |
| CST World History Test | |||
| 2010 | 54.0% | 47.0% | 41.0% |
| 2009 | 48.0% | 40.0% | 38.0% |
| 2008 | 50.0% | 36.0% | 33.0% |
Source: CA Department of Education 2009-2010
School Map and Similar Schools Nearby
Click to Activate Map of Nearby School Campuses
Private
Public
This School
Similar Schools Nearby
| Santana High School 9-12 | 1,488 Students | 2.5 miles away | ![]() 3 out of 5 | |
| Henry High School 9-12 | 2,466 Students | 4.2 miles away | Not Yet Rated | |
| El Cajon Valley High School 9-12 | 2,374 Students | 5.1 miles away | ![]() 5 out of 5 | |
| El Capitan High School 9-12 | 1,887 Students | 5.7 miles away | Not Yet Rated | |
| Serra High School 9-12 | 2,087 Students | 5.8 miles away | Not Yet Rated | |
| Granite Hills High School 9-12 | 2,799 Students | 6.6 miles away | Not Yet Rated | |
| Scripps Ranch High School 9-12 | 2,390 Students | 7.1 miles away | Not Yet Rated | |
| Invention and Design Educational Academy 9-12 | 331 Students | 7.7 miles away | Not Yet Rated | |
| Hoover High School 9-12 | 2,163 Students | 8.1 miles away | Not Yet Rated | |
| Valhalla High School 9-12 | 2,237 Students | 8.2 miles away | ![]() 1 out of 5 | |
Compare This School To Nearby Schools ->
School Community Forum

Join a discussion about West Hills High School and talk to others in the community including students, parents, teachers, and administrators.
Popular Discussion Topics
- Admissions and Registration Questions (e.g. Dress Code and Discipline Policy)
- School Calendar and Upcoming Events (e.g. Graduation)
- After School Programs, Extracurricular Activities, and Athletics (e.g. Football)
- News and Announcements (e.g. Yearbook and Class Supply List Details)
- Graduate and Alumni Events (e.g. Organizing Class Reunions)
Navigation
Can't Find What You Are Looking For?
Rankings
Nearby Cities
Sponsored Links
K-12 Articles
The Impact on Adopted Children at School
Children who are adopted can be affected both academically and socially at school. Many times...
Who is Safe?
Between September 26 and October 2, 2006, there were three deadly school shootings and...
The Importance of Reading for Children Preschool to Grade Three
The first teachers of children are their parents. From the time they are infants, children need to...


(5 / 5) 

