Andress High School
Rating
Not Available
Not Available

5 out of 5 | 1 Review
Find Old Friends From Andress High School
Use the form below to search for alumni from Andress High School.
School Description
School Summary and Highlights
- Enrolls 1,827 high school students from grades 9-12
- Ranks 1027th out of 1,325 high schools in TX.
- 2010 Overall School AYP Met Status: Yes
Additional Contact Information
- Principal or Admin: Mr James Anderson
- Fax: (915) 757-6443
- Website: www.episd.org
School Operational Details
- Title I EligibleAll students of this school are eligible for participation in authorized programs.
School District Details
- El Paso Independent School District (ISD)
- Per-Pupil Spending: $8,615
- Graduation Rate: 66.5%
- Dropout Rate: 4.8%
- Students Per Teacher: 14.4
- Enrolled Students: 63,378
Faculty Details and Student Enrollment
Students and Faculty
- Total Students Enrolled: 1,827
- Total Full Time "Equivalent" Teachers: 117.4
- Average Student-To-Teacher Ratio: 15.6
Students Gender Breakdown
- Males: 972 (53.2%)
- Females: 855 (46.8%)
Free Lunch Student Eligibility Breakdown
- Eligible for Reduced Lunch: 192 (10.5%)
- Eligible for Free Lunch: 832 (45.5%)
- Eligible for Either Reduced or Free Lunch: 1,024 (56.0%)
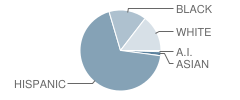
Student Enrollment Distribution by Race / Ethnicity
| Number | Percent | |
|---|---|---|
| American Indian | 9 | 0.5% |
| Black | 274 | 15.0% |
| Asian | 29 | 1.6% |
| Hispanic | 1,249 | 68.4% |
| White | 266 | 14.6% |
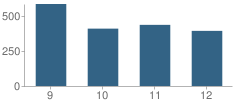
Number of Students Per Grade
| Number | Percent | |
|---|---|---|
| 9th Grade | 586 | 32.1% |
| 10th Grade | 410 | 22.4% |
| 11th Grade | 437 | 23.9% |
| 12th Grade | 394 | 21.6% |
Breakdown of College Ready Graduates (2009)
Percent Ready For College in Reading
School:
41.0%
District:
54.0%
State:
62.0%
Percent Ready For College in Math
School:
44.0%
District:
39.0%
State:
60.0%
Graduation & Dropout Rates (2009)
Graduation Rate
School:
72.9%
District:
73.8%
State:
80.6%
Dropout Rate
School:
13.9%
District:
11.6%
State:
9.4%
Faculty Breakdown (2010)
Average Teacher Experience
School:
11.8
District:
12.1
State:
11.3
Percent of Teachers With 1-5 Years Experience
School:
38.3%
District:
28.2%
State:
31.0%
Percent of Teachers With 6-10 Years Experience
School:
15.9%
District:
21.4%
State:
20.3%
Percent of Teachers With 11-20 Years Experience
School:
18.8%
District:
25.2%
State:
24.4%
Percent of Teachers With Greater Than 20 Years Experience
School:
21.9%
District:
20.7%
State:
18.3%
Faculty Salary (2010)
School Administration Average Base Salary
School:
$80,927
District:
$76,334
State:
$70,209
Teacher Average Base Salary
School:
$49,191
District:
$49,168
State:
$48,263
Beginning Teacher Average Base Salary
School:
$43,003
District:
$42,615
State:
$41,165
Teacher With 1-5 Years Experience Average Base Salary
School:
$44,537
State:
$43,527
Teacher With 6-10 Years Experience Average Base Salary
School:
$46,194
State:
$46,149
Teacher With 11-20 Years Experience Average Base Salary
School:
$50,621
State:
$50,153
Teacher With Greater Than 20 Years Experience Average Base Salary
School:
$59,719
State:
$58,427
Source: TX Department of Education, Source: NCES 2009-2010
School Ratings and Reviews
Overall Rating: 5

5 out of 5 | 1 Review
The Overall Rating is the school's average rating from parents, students, school faculty and staff. The highest rating is five apples and the lowest is one apple.
Share Your Review About This School
1 review for Andress High School
- Reviewed by Student on January 27, 2010
- Rating:
 (5 / 5) Flag as inappropriate
 - ANDRESS HIGH SCHOOL IS THE BEST! GO EAGLES!!!!!!!
School Map and Similar Schools Nearby
Click to Activate Map of Nearby School Campuses
Private
Public
This School
Similar Schools Nearby
| Parkland High School 9-12 | 1,343 Students | 0.9 miles away | Not Yet Rated | |
| Transmountain Early College High School 9-10 | 223 Students | 1.1 miles away | Not Yet Rated | |
| Irvin High School 9-12 | 1,740 Students | 2.1 miles away |  5 out of 5 | |
| Chapin High School 9-12 | 1,944 Students | 4.7 miles away | 5 out of 5 | |
| Austin High School 9-12 | 1,509 Students | 7.9 miles away |  3 out of 5 | |
| Burges High School 9-12 | 1,562 Students | 8.7 miles away | 3 out of 5 | |
| Franklin High School 9-12 | 3,073 Students | 9.0 miles away |  2.5 out of 5 | |
| Coronado High School 9-12 | 2,604 Students | 9.2 miles away | 5 out of 5 | |
| Jefferson High School 9-12 | 1,110 Students | 9.7 miles away | Not Yet Rated | |
| Silva Health Magnet School 9-12 | 540 Students | 9.7 miles away | Not Yet Rated | |
Compare This School To Nearby Schools ->
School Community Forum

Join a discussion about Andress High School and talk to others in the community including students, parents, teachers, and administrators.
Popular Discussion Topics
- Admissions and Registration Questions (e.g. Dress Code and Discipline Policy)
- School Calendar and Upcoming Events (e.g. Graduation)
- After School Programs, Extracurricular Activities, and Athletics (e.g. Football)
- News and Announcements (e.g. Yearbook and Class Supply List Details)
- Graduate and Alumni Events (e.g. Organizing Class Reunions)
Navigation
Can't Find What You Are Looking For?
Sponsored Links
K-12 Articles

Preparing Your Child for the First Day of School
It seems like school was just dismissed for the summer, yet here we are facing another year of back...
It seems like school was just dismissed for the summer, yet here we are facing another year of back...

Helping Your Learning Disabled Child
Thousands of children in America struggle to learn on a daily basis. Many of them have invisible...
Thousands of children in America struggle to learn on a daily basis. Many of them have invisible...

Feeling Good in Your Own Skin
Body image is a very touchy issue with today's kids. Since the 1950s, when Barbie was first...
Body image is a very touchy issue with today's kids. Since the 1950s, when Barbie was first...