Stephen F Austin High School
3434 Pheasant Creek Dr, Sugar Land, TX 77478 | (281) 634-2000
- Grades: 8-12
- Student Enrollment: 2,351
Rating
Not Available
Not Available

No Reviews Yet
Find Old Friends From Stephen F Austin High School
Use the form below to search for alumni from Stephen F Austin High School.
School Description
School Summary and Highlights
- Enrolls 2,351 middle and high school students from grades 8-12
- Ranks 114th out of 1,325 high schools in TX.
- 2010 Overall School AYP Met Status: Yes
Additional Contact Information
- Principal or Admin: Michael Leach
- Fax: (281) 634-2074
- Website: www.fortbend.k12.tx.us
School District Details
- Fort Bend Independent School District (ISD)
- Per-Pupil Spending: $7,636
- Graduation Rate: 82.2%
- Dropout Rate: 2.4%
- Students Per Teacher: 15.9
- Enrolled Students: 69,374
Faculty Details and Student Enrollment
Students and Faculty
- Total Students Enrolled: 2,351
- Total Full Time "Equivalent" Teachers: 127.7
- Average Student-To-Teacher Ratio: 18.4
Students Gender Breakdown
- Males: 1,200 (51.0%)
- Females: 1,151 (49.0%)
Free Lunch Student Eligibility Breakdown
- Eligible for Reduced Lunch: 89 (3.8%)
- Eligible for Free Lunch: 264 (11.2%)
- Eligible for Either Reduced or Free Lunch: 353 (15.0%)
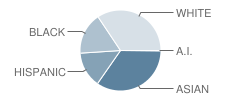
Student Enrollment Distribution by Race / Ethnicity
| Number | Percent | |
|---|---|---|
| American Indian | 5 | 0.2% |
| Black | 392 | 16.7% |
| Asian | 810 | 34.5% |
| Hispanic | 336 | 14.3% |
| White | 808 | 34.4% |
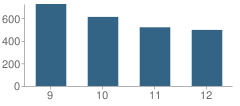
Number of Students Per Grade
| Number | Percent | |
|---|---|---|
| 9th Grade | 725 | 30.8% |
| 10th Grade | 611 | 26.0% |
| 11th Grade | 519 | 22.1% |
| 12th Grade | 496 | 21.1% |
Breakdown of College Ready Graduates (2009)
Percent Ready For College in Reading
School:
88.0%
District:
75.0%
State:
62.0%
Percent Ready For College in Math
School:
82.0%
District:
53.0%
State:
60.0%
Graduation & Dropout Rates (2009)
Graduation Rate
School:
93.6%
District:
88.3%
State:
80.6%
Dropout Rate
School:
2.0%
District:
5.4%
State:
9.4%
Faculty Breakdown (2010)
Average Teacher Experience
School:
11.6
District:
10.7
State:
11.3
Percent of Teachers With 1-5 Years Experience
School:
24.0%
District:
32.8%
State:
31.0%
Percent of Teachers With 6-10 Years Experience
School:
23.7%
District:
24.2%
State:
20.3%
Percent of Teachers With 11-20 Years Experience
School:
22.8%
District:
22.6%
State:
24.4%
Percent of Teachers With Greater Than 20 Years Experience
School:
19.9%
District:
15.1%
State:
18.3%
Faculty Salary (2010)
School Administration Average Base Salary
School:
$84,353
District:
$76,606
State:
$70,209
Teacher Average Base Salary
School:
$52,676
District:
$51,846
State:
$48,263
Beginning Teacher Average Base Salary
School:
$44,426
District:
$40,216
State:
$41,165
Teacher With 1-5 Years Experience Average Base Salary
School:
$47,191
State:
$43,527
Teacher With 6-10 Years Experience Average Base Salary
School:
$49,409
State:
$46,149
Teacher With 11-20 Years Experience Average Base Salary
School:
$54,860
State:
$50,153
Teacher With Greater Than 20 Years Experience Average Base Salary
School:
$64,717
State:
$58,427
Source: TX Department of Education, Source: NCES 2009-2010
School Ratings and Reviews
Be The First To Review Stephen F Austin High School!
School Map and Similar Schools Nearby
Click to Activate Map of Nearby School Campuses
Private
Public
This School
Similar Schools Nearby
| Kempner High School 9-12 | 2,537 Students | 2.1 miles away |  5 out of 5 | |
| George Bush High School 9-12 | 2,017 Students | 4.5 miles away | 5 out of 5 | |
| Kerr High School 9-12 | 767 Students | 4.5 miles away | Not Yet Rated | |
| Taylor High School 9-12 | 2,835 Students | 4.8 miles away | 5 out of 5 | |
| Clements High School 9-12 | 2,802 Students | 5.3 miles away | Not Yet Rated | |
| Dulles High School 9-12 | 2,083 Students | 6.0 miles away | Not Yet Rated | |
| Juvenile Detention Center School 6-12 | 27 Students | 6.2 miles away |  3 out of 5 | |
| Elsik High School 9-12 | 4,166 Students | 6.8 miles away | Not Yet Rated | |
| Hastings High School 9-12 | 4,233 Students | 7.0 miles away | Not Yet Rated | |
| Alief Early College High School 9 | 116 Students | 7.1 miles away | Not Yet Rated | |
Compare This School To Nearby Schools ->
School Community Forum

Join a discussion about Stephen F Austin High School and talk to others in the community including students, parents, teachers, and administrators.
Popular Discussion Topics
- Admissions and Registration Questions (e.g. Dress Code and Discipline Policy)
- School Calendar and Upcoming Events (e.g. Graduation)
- After School Programs, Extracurricular Activities, and Athletics (e.g. Football)
- News and Announcements (e.g. Yearbook and Class Supply List Details)
- Graduate and Alumni Events (e.g. Organizing Class Reunions)
Navigation
Can't Find What You Are Looking For?
Nearby Cities
Sponsored Links
K-12 Articles

Attend Your Teen's Holiday Parties
Christmas and New Years are coming, and with them Christmas and New Years Eve parties. At many of...
Christmas and New Years are coming, and with them Christmas and New Years Eve parties. At many of...

Internet Safety for Kids of All Ages
Kids are being introduced to the Internet at a very young age. Research for homework and school...
Kids are being introduced to the Internet at a very young age. Research for homework and school...

When Bad Report Cards Happen to Good Kids
It's mid-term season once again, and semester (or quarter or trimester) grades will be coming out...
It's mid-term season once again, and semester (or quarter or trimester) grades will be coming out...