William Workman High School
16303 East Temple Ave, City of Industry, CA 91744 | (626) 933-8800
- Grades: 9-12
- Student Enrollment: 1,202
Rating
Not Available
Not Available

4 out of 5 | 4 Reviews
Find Old Friends From William Workman High School
Use the form below to search for alumni from William Workman High School.
School Description
School Summary and Highlights
- Enrolls 1,202 high school students from grades 9-12
- Ranks 945th out of 1,197 high schools in CA.
- 2010 Overall School AYP Met Status: No
Additional Contact Information
- Mailing Address: 16303 East Temple Ave., City of Industry, CA 91744
School District Details
- Hacienda La Puente Unified School District
- Per-Pupil Spending: $9,567
- Graduation Rate: 65.4%
- Dropout Rate: 3.0%
- Students Per Teacher: 20.9
- Enrolled Students: 21,282
Faculty Details and Student Enrollment
Students and Faculty
- Total Students Enrolled: 1,202
- Total Full Time "Equivalent" Teachers: 61.7
- Average Student-To-Teacher Ratio: 19.5
Students Gender Breakdown
- Males: 613 (51.0%)
- Females: 589 (49.0%)
Free Lunch Student Eligibility Breakdown
- Eligible for Reduced Lunch: 227 (18.9%)
- Eligible for Free Lunch: 788 (65.6%)
- Eligible for Either Reduced or Free Lunch: 1,015 (84.4%)
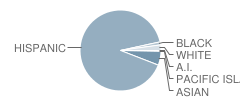
Student Enrollment Distribution by Race / Ethnicity
| Number | Percent | |
|---|---|---|
| American Indian | 2 | 0.2% |
| Black | 15 | 1.2% |
| Asian | 67 | 5.6% |
| Hispanic | 1,082 | 90.0% |
| White | 27 | 2.2% |
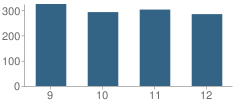
Number of Students Per Grade
| Number | Percent | |
|---|---|---|
| 9th Grade | 324 | 27.0% |
| 10th Grade | 292 | 24.3% |
| 11th Grade | 302 | 25.1% |
| 12th Grade | 284 | 23.6% |
Graduates Information (2010)
Graduation Rate
School:
73.5%
District:
72.5%
State:
78.6%
Teacher Education Background (2009)
Percent With Master's Degree
School:
24.6%
District:
33.3%
Percent With Bachelor's Degree
School:
26.2%
District:
6.3%
Percent With Ph.D.
School:
1.5%
District:
6.3%
Teacher Credentials & Experience (2009)
Average Age
School:
36.7
District:
44.9
Average Number of Years of Teacher Experience: 9.1
Number of Certificated Staff: 65.0
Percent of Teachers With Credentials: 85.0%
Source: CA Department of Education, Source: NCES 2009-2010
School Ratings and Reviews
Overall Rating: 4

4 out of 5 | 4 Reviews
The Overall Rating is the school's average rating from parents, students, school faculty and staff. The highest rating is five apples and the lowest is one apple.
Share Your Review About This School
4 reviews for William Workman High School
- Reviewed by Former Student on June 20, 2010
- Rating:
 (4 / 5) Flag as inappropriate
 - I graduated in 1978. No violence, very easy going student body. Fun. Good decent education. No gangs or problems. We had a smokers corner that I remember.
- Reviewed by Former Student on April 15, 2010
- Rating:
 (5 / 5) Flag as inappropriate
 - I was of the 1973 graduating class.
This was a fine learning enstitute, and from what I read continues to provide a well rounded education
- Reviewed by Student on April 23, 2009
- Rating:
 (3 / 5) Flag as inappropriate
 - I graduated class of 1982. Workman was not an outstanding school at the time. It was the little school that tried. Some what overwhelmed by the surrounding high schools. Any of them.
I cannot speak to the current stauts of the school, but it was a working class area at the time I attended. I had no fear of violence or gangs. I've gone on to become a productive member of society and a parent. I hope I have given back more than I have taken.
- Reviewed by Former Student on August 28, 2007
- Rating: (3 / 5) Flag as inappropriate
- as a former student there i was too exposed to continuous violence and constant unorganized activities on campus. that school has been going through changes and just needs the right leader to accomplish the visions that parents want fulfilled, however on the good side veteran teachers are the key to providing success to your student as well as the encouragement to keep your child on the right track.
School Map and Similar Schools Nearby
Click to Activate Map of Nearby School Campuses
Private
Public
This School
Similar Schools Nearby
| La Puente High School 9-12 | 1,666 Students | 1.1 miles away |  3 out of 5 | |
| Glen A. Wilson High School 9-12 | 1,748 Students | 2.1 miles away | Not Yet Rated | |
| Los Altos High School 9-12 | 2,056 Students | 2.6 miles away |  5 out of 5 | |
| West Covina High School 9-12 | 2,914 Students | 2.7 miles away |  4 out of 5 | |
| Bassett High School 9-12 | 1,294 Students | 2.8 miles away |  3.5 out of 5 | |
| Nogales High School 9-12 | 2,252 Students | 3.1 miles away | 3.5 out of 5 | |
| Covina High School 9-12 | 1,506 Students | 4.3 miles away | Not Yet Rated | |
| John A. Rowland High School 9-12 | 2,310 Students | 4.4 miles away | Not Yet Rated | |
| Mountain View High School 9-12 | 1,866 Students | 4.7 miles away | Not Yet Rated | |
| South Hills High School 9-12 | 2,067 Students | 4.7 miles away | 5 out of 5 | |
Compare This School To Nearby Schools ->
School Community Forum

Join a discussion about William Workman High School and talk to others in the community including students, parents, teachers, and administrators.
Popular Discussion Topics
- Admissions and Registration Questions (e.g. Dress Code and Discipline Policy)
- School Calendar and Upcoming Events (e.g. Graduation)
- After School Programs, Extracurricular Activities, and Athletics (e.g. Football)
- News and Announcements (e.g. Yearbook and Class Supply List Details)
- Graduate and Alumni Events (e.g. Organizing Class Reunions)
Navigation
Can't Find What You Are Looking For?
Rankings
Nearby Cities
Sponsored Links
K-12 Articles

How to Get the Best Supplies for Your Money
School supply lists can seem unending, and the price can add up very quickly. But do we really...
School supply lists can seem unending, and the price can add up very quickly. But do we really...

The First Day of School
The first day of kindergarten is a rite of passage for any student. Every mother cries and...
The first day of kindergarten is a rite of passage for any student. Every mother cries and...

Helping Your Child Leave the Nest
It’s all come down to this: Eighteen years of good times and bad, and now your baby bird is ready...
It’s all come down to this: Eighteen years of good times and bad, and now your baby bird is ready...