Lee Richmond Elementary School
Rating
Not Available
Not Available

No Reviews Yet
Find Old Friends From Lee Richmond Elementary School
Use the form below to search for alumni from Lee Richmond Elementary School.
School Description
School Summary and Highlights
- Enrolls 400 elementary school students from grades KG-6
- Ranks 3083rd out of 5,423 elementary schools in CA.
- 2010 Overall School AYP Met Status: Yes
Additional Contact Information
- Mailing Address: PO Box 1067, Hanford, CA 93232
School Operational Details
- Title I EligibleAll students of this school are eligible for participation in authorized programs.
School District Details
- Hanford Elementary School District
- Per-Pupil Spending: $8,708
- Students Per Teacher: 21.0
- Enrolled Students: 5,572
Faculty Details and Student Enrollment
Students and Faculty
- Total Students Enrolled: 400
- Total Full Time "Equivalent" Teachers: 19.0
- Average Student-To-Teacher Ratio: 21.1
Students Gender Breakdown
- Males: 198 (49.5%)
- Females: 202 (50.5%)
Free Lunch Student Eligibility Breakdown
- Eligible for Reduced Lunch: 36 (9.0%)
- Eligible for Free Lunch: 323 (80.8%)
- Eligible for Either Reduced or Free Lunch: 359 (89.8%)
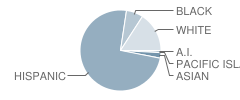
Student Enrollment Distribution by Race / Ethnicity
| Number | Percent | |
|---|---|---|
| American Indian | 3 | 0.8% |
| Black | 27 | 6.8% |
| Asian | 9 | 2.3% |
| Hispanic | 294 | 73.5% |
| White | 63 | 15.8% |
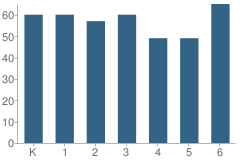
Number of Students Per Grade
| Number | Percent | |
|---|---|---|
| Kindergarten | 60 | 15.0% |
| 1st Grade | 60 | 15.0% |
| 2nd Grade | 57 | 14.3% |
| 3rd Grade | 60 | 15.0% |
| 4th Grade | 49 | 12.3% |
| 5th Grade | 49 | 12.3% |
| 6th Grade | 65 | 16.3% |
Teacher Education Background (2009)
Percent With Master's Degree
School:
40.9%
District:
55.6%
Percent With Bachelor's Degree
School:
4.5%
District:
7.4%
Teacher Credentials & Experience (2009)
Percent of Teachers With Credentials: 95.0%
Number of Certificated Staff: 22.0
Average Number of Years of Teacher Experience: 6.9
Average Age
School:
32.5
District:
40.7
Source: CA Department of Education, Source: NCES 2009-2010
School Ratings and Reviews
Be The First To Review Lee Richmond Elementary School!
School Map and Similar Schools Nearby
Click to Activate Map of Nearby School Campuses
Private
Public
This School
Similar Schools Nearby
| Hamilton Elementary School KG-6 | 573 Students | 0.7 miles away | Not Yet Rated | |
| George Washington Elementary School KG-6 | 556 Students | 0.9 miles away | Not Yet Rated | |
| Monroe Elementary School KG-6 | 650 Students | 1.2 miles away |  5 out of 5 | |
| Lincoln Elementary School KG-6 | 468 Students | 1.9 miles away | Not Yet Rated | |
| Joseph M. Simas School KG-6 | 653 Students | 2.1 miles away | 5 out of 5 | |
| Roosevelt Elementary School KG-6 | 478 Students | 2.2 miles away |  4.5 out of 5 | |
| Kit Carson Elementary School KG-8 | 431 Students | 2.9 miles away | Not Yet Rated | |
| Pioneer Elementary School KG-5 | 216 Students | 4.3 miles away | Not Yet Rated | |
| Parkview Middle School 5-8 | 389 Students | 4.6 miles away | Not Yet Rated | |
| Armona Elementary School KG-4 | 574 Students | 4.7 miles away | 5 out of 5 | |
Compare This School To Nearby Schools ->
School Community Forum

Join a discussion about Lee Richmond Elementary School and talk to others in the community including students, parents, teachers, and administrators.
Popular Discussion Topics
- Admissions and Registration Questions (e.g. Dress Code and Discipline Policy)
- School Calendar and Upcoming Events (e.g. Graduation)
- After School Programs, Extracurricular Activities, and Athletics (e.g. Football)
- News and Announcements (e.g. Yearbook and Class Supply List Details)
- Graduate and Alumni Events (e.g. Organizing Class Reunions)
Navigation
Can't Find What You Are Looking For?
Rankings
Nearby Cities
Sponsored Links
K-12 Articles

The Very Best Things in the World
A recent poll in the U.K. revealed that children view the "very best thing in the world" as being...
A recent poll in the U.K. revealed that children view the "very best thing in the world" as being...

Beating the Summer Slump
"The Summer Slump", teachers call it. It happens every year. It makes its way into lesson plans...
"The Summer Slump", teachers call it. It happens every year. It makes its way into lesson plans...

Making Sense of No Child Left Behind
The No Child Left Behind Act of 2001 has met with mixed results and mixed feelings. Some think it...
The No Child Left Behind Act of 2001 has met with mixed results and mixed feelings. Some think it...