Beaver Technology Center School
Rating
Not Available
Not Available

5 out of 5 | 2 Reviews
Find Old Friends From Beaver Technology Center School
Use the form below to search for alumni from Beaver Technology Center School.
School Description
School Summary and Highlights
- Enrolls 564 preschool and elementary school students from grades PK-5
- Ranks 362nd out of 4,319 elementary schools in TX.
- 2010 Overall School AYP Met Status: Yes
Additional Contact Information
- Principal or Admin: Ms Mida Milligan
- Fax: (972) 485-4936
- Website: www.garlandisd.net
School Operational Details
- Title I EligibleAll students of this school are eligible for participation in authorized programs.
School District Details
- Garland Independent School District (ISD)
- Per-Pupil Spending: $7,632
- Graduation Rate: 76.1%
- Dropout Rate: 3.5%
- Students Per Teacher: 15.6
- Enrolled Students: 57,861
Faculty Details and Student Enrollment
Students and Faculty
- Total Students Enrolled: 564
- Total Full Time "Equivalent" Teachers: 31.2
- Average Student-To-Teacher Ratio: 18.1
Students Gender Breakdown
- Males: 292 (51.8%)
- Females: 272 (48.2%)
Free Lunch Student Eligibility Breakdown
- Eligible for Reduced Lunch: 46 (8.2%)
- Eligible for Free Lunch: 246 (43.6%)
- Eligible for Either Reduced or Free Lunch: 292 (51.8%)
Student Enrollment Distribution by Race / Ethnicity
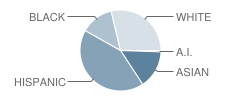
| Number | Percent | |
|---|---|---|
| American Indian | 3 | 0.5% |
| Black | 74 | 13.1% |
| Asian | 86 | 15.2% |
| Hispanic | 239 | 42.4% |
| White | 162 | 28.7% |
Number of Students Per Grade
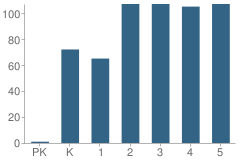
| Number | Percent | |
|---|---|---|
| Pre-Kindergarten | 1 | 0.2% |
| Kindergarten | 72 | 12.8% |
| 1st Grade | 65 | 11.5% |
| 2nd Grade | 107 | 19.0% |
| 3rd Grade | 107 | 19.0% |
| 4th Grade | 105 | 18.6% |
| 5th Grade | 107 | 19.0% |
Faculty Breakdown (2010)
Average Teacher Experience
School:
12.0
District:
11.2
State:
11.3
Percent of Teachers With 1-5 Years Experience
School:
38.5%
District:
33.6%
State:
31.0%
Percent of Teachers With 6-10 Years Experience
School:
16.0%
District:
23.3%
State:
20.3%
Percent of Teachers With 11-20 Years Experience
School:
13.4%
District:
23.1%
State:
24.4%
Percent of Teachers With Greater Than 20 Years Experience
School:
25.7%
District:
16.9%
State:
18.3%
Faculty Salary (2010)
School Administration Average Base Salary
School:
$78,509
District:
$79,260
State:
$70,209
Teacher Average Base Salary
School:
$50,705
District:
$50,541
State:
$48,263
Beginning Teacher Average Base Salary
School:
$46,000
District:
$47,318
State:
$41,165
Teacher With 1-5 Years Experience Average Base Salary
School:
$46,439
State:
$43,527
Teacher With 6-10 Years Experience Average Base Salary
School:
$47,997
State:
$46,149
Teacher With 11-20 Years Experience Average Base Salary
School:
$50,987
State:
$50,153
Teacher With Greater Than 20 Years Experience Average Base Salary
School:
$59,823
State:
$58,427
Source: TX Department of Education, Source: NCES 2009-2010
School Ratings and Reviews
Overall Rating: 5

5 out of 5 | 2 Reviews
The Overall Rating is the school's average rating from parents, students, school faculty and staff. The highest rating is five apples and the lowest is one apple.
Share Your Review About This School
2 reviews for Beaver Technology Center School
- Reviewed by Former Student on November 30, 2010
- Rating:
 (5 / 5) Flag as inappropriate
 - this is the best school I've ever been to. the principle and vice principle are as nice as when a kid sweets talk his or her parents for a toy.the school teaches a lot of history to the kids.they teach the kids so good when there in middle school their teachers will have to check there hands to make sure there not cheating.this is an exemplary school. thank you
- Reviewed by Parent/Guardian on November 11, 2009
- Rating: (5 / 5) Flag as inappropriate
- The administration at this school is amazing. They subscribe to Love and Logic and they understand that kids are kids and they make mistakes. They deal with issues and problems accordingly and with love and understanding. My child was not a "terrible" kid, but those few times he did get in trouble I felt that the staff did a fabulous job at helping him understand what he did wrong as well as help him learn how to avoid issues in the future.
School Map and Similar Schools Nearby
Click to Activate Map of Nearby School Campuses
Private
Public
This School
Similar Schools Nearby
| Davis Elementary School PK-5 | 706 Students | 0.4 miles away |  1 out of 5 | |
| Walnut Glen Academy for Excellence PK-5 | 523 Students | 0.5 miles away | Not Yet Rated | |
| Bradfield Elementary School PK-5 | 495 Students | 0.7 miles away | Not Yet Rated | |
| Bullock Elementary School PK-5 | 568 Students | 0.9 miles away |  5 out of 5 | |
| O Henry Elementary School PK-6 | 456 Students | 1.0 miles away | Not Yet Rated | |
| Ethridge Elementary School KG-5 | 726 Students | 1.2 miles away | 5 out of 5 | |
| Golden Meadows Elementary School PK-5 | 587 Students | 1.4 miles away | Not Yet Rated | |
| Springridge Elementary School KG-6 | 403 Students | 1.4 miles away | Not Yet Rated | |
| Forestridge Elementary School PK-6 | 666 Students | 1.7 miles away | Not Yet Rated | |
| Freeman Elementary School PK-5 | 377 Students | 1.9 miles away | Not Yet Rated | |
Compare This School To Nearby Schools ->
School Community Forum

Join a discussion about Beaver Technology Center School and talk to others in the community including students, parents, teachers, and administrators.
Popular Discussion Topics
- Admissions and Registration Questions (e.g. Dress Code and Discipline Policy)
- School Calendar and Upcoming Events (e.g. Graduation)
- After School Programs, Extracurricular Activities, and Athletics (e.g. Football)
- News and Announcements (e.g. Yearbook and Class Supply List Details)
- Graduate and Alumni Events (e.g. Organizing Class Reunions)
Navigation
Can't Find What You Are Looking For?
Nearby Cities
Sponsored Links
K-12 Articles

Summer Reading
In 1998, a book was published in the US that turned a hatred of reading to love. "Harry Potter and...
In 1998, a book was published in the US that turned a hatred of reading to love. "Harry Potter and...

Breakfast, Kids and Learning
For generations parents have been telling their kids that breakfast is the most important meal of...
For generations parents have been telling their kids that breakfast is the most important meal of...

Educators and Childhood Obesity
Obesity in childhood is rising to epidemic proportions in America and educators should be...
Obesity in childhood is rising to epidemic proportions in America and educators should be...