Rowlett High School
Rating
Not Available
Not Available

No Reviews Yet
Find Old Friends From Rowlett High School
Use the form below to search for alumni from Rowlett High School.
School Description
School Summary and Highlights
- Enrolls 2,613 high school students from grades 9-12
- Ranks 214th out of 1,325 high schools in TX.
- 2010 Overall School AYP Met Status: Yes
Additional Contact Information
- Principal or Admin: Dr Marlene Hammerle
- Fax: (972) 763-8692
- Website: www.garlandisd.net
School District Details
- Garland Independent School District (ISD)
- Per-Pupil Spending: $7,632
- Graduation Rate: 76.1%
- Dropout Rate: 3.5%
- Students Per Teacher: 15.6
- Enrolled Students: 57,861
Faculty Details and Student Enrollment
Students and Faculty
- Total Students Enrolled: 2,613
- Total Full Time "Equivalent" Teachers: 158.4
- Average Student-To-Teacher Ratio: 16.5
Students Gender Breakdown
- Males: 1,360 (52.0%)
- Females: 1,253 (48.0%)
Free Lunch Student Eligibility Breakdown
- Eligible for Reduced Lunch: 118 (4.5%)
- Eligible for Free Lunch: 553 (21.2%)
- Eligible for Either Reduced or Free Lunch: 671 (25.7%)
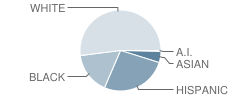
Student Enrollment Distribution by Race / Ethnicity
| Number | Percent | |
|---|---|---|
| American Indian | 10 | 0.4% |
| Black | 432 | 16.5% |
| Asian | 116 | 4.4% |
| Hispanic | 696 | 26.6% |
| White | 1,359 | 52.0% |
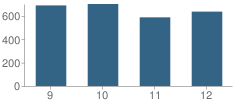
Number of Students Per Grade
| Number | Percent | |
|---|---|---|
| 9th Grade | 689 | 26.4% |
| 10th Grade | 701 | 26.8% |
| 11th Grade | 587 | 22.5% |
| 12th Grade | 636 | 24.3% |
Breakdown of College Ready Graduates (2009)
Percent Ready For College in Reading
School:
66.0%
District:
58.0%
State:
62.0%
Percent Ready For College in Math
School:
72.0%
District:
37.0%
State:
60.0%
Graduation & Dropout Rates (2009)
Graduation Rate
School:
92.6%
District:
82.8%
State:
80.6%
Dropout Rate
School:
3.8%
District:
8.1%
State:
9.4%
Faculty Breakdown (2010)
Average Teacher Experience
School:
10.4
District:
11.2
State:
11.3
Percent of Teachers With 1-5 Years Experience
School:
31.9%
District:
33.6%
State:
31.0%
Percent of Teachers With 6-10 Years Experience
School:
24.1%
District:
23.3%
State:
20.3%
Percent of Teachers With 11-20 Years Experience
School:
26.0%
District:
23.1%
State:
24.4%
Percent of Teachers With Greater Than 20 Years Experience
School:
12.4%
District:
16.9%
State:
18.3%
Faculty Salary (2010)
School Administration Average Base Salary
School:
$76,064
District:
$79,260
State:
$70,209
Teacher Average Base Salary
School:
$51,253
District:
$50,541
State:
$48,263
Beginning Teacher Average Base Salary
School:
$48,832
District:
$47,318
State:
$41,165
Teacher With 1-5 Years Experience Average Base Salary
School:
$48,365
State:
$43,527
Teacher With 6-10 Years Experience Average Base Salary
School:
$49,787
State:
$46,149
Teacher With 11-20 Years Experience Average Base Salary
School:
$52,144
State:
$50,153
Teacher With Greater Than 20 Years Experience Average Base Salary
School:
$60,729
State:
$58,427
Source: TX Department of Education, Source: NCES 2009-2010
School Ratings and Reviews
Be The First To Review Rowlett High School!
School Map and Similar Schools Nearby
Click to Activate Map of Nearby School Campuses
Private
Public
This School
Similar Schools Nearby
| Sachse High School 9-12 | 2,564 Students | 3.3 miles away | Not Yet Rated | |
| Lakeview Centennial High School 9-12 | 2,048 Students | 3.6 miles away |  2.5 out of 5 | |
| S Garland High School 9-12 | 2,015 Students | 4.5 miles away | Not Yet Rated | |
| Garland High School 9-12 | 2,635 Students | 5.6 miles away |  3.5 out of 5 | |
| Rockwall High School 9-12 | 2,046 Students | 5.7 miles away | 3.5 out of 5 | |
| Rockwall-Heath High School 9-12 | 1,975 Students | 6.1 miles away | Not Yet Rated | |
| Naaman Forest High School 9-12 | 2,445 Students | 6.4 miles away | 3.5 out of 5 | |
| N Garland High School 9-12 | 2,203 Students | 6.7 miles away |  2 out of 5 | |
| Raymond B Cooper Junior High School 7-8 | 554 Students | 6.9 miles away | Not Yet Rated | |
| Wylie East High School 9-10 | 720 Students | 7.1 miles away | Not Yet Rated | |
Compare This School To Nearby Schools ->
School Community Forum

Join a discussion about Rowlett High School and talk to others in the community including students, parents, teachers, and administrators.
Popular Discussion Topics
- Admissions and Registration Questions (e.g. Dress Code and Discipline Policy)
- School Calendar and Upcoming Events (e.g. Graduation)
- After School Programs, Extracurricular Activities, and Athletics (e.g. Football)
- News and Announcements (e.g. Yearbook and Class Supply List Details)
- Graduate and Alumni Events (e.g. Organizing Class Reunions)
Navigation
Can't Find What You Are Looking For?
Nearby Cities
Sponsored Links
K-12 Articles

Public or Private?
Daniel attended private school until sixth grade, when he was diagnosed with Asperger's Syndrome, a...
Daniel attended private school until sixth grade, when he was diagnosed with Asperger's Syndrome, a...

Assisting Students to Overcome Test Anxiety
Every human copes with anxiety at one time or another. It is a basic emotion that we feel when...
Every human copes with anxiety at one time or another. It is a basic emotion that we feel when...

Special Needs Education: Your Child, Your Rights
Many children today have special needs that make it difficult for them to learn. It's imperative...
Many children today have special needs that make it difficult for them to learn. It's imperative...