Granger School
Rating
Not Available
Not Available

No Reviews Yet
Find Old Friends From Granger School
Use the form below to search for alumni from Granger School.
School Description
School Summary and Highlights
- Enrolls 427 school students from grades PK-12
- Ranks 937th out of 1,325 high schools in TX.
- 2010 Overall School AYP Met Status: Yes
Additional Contact Information
- Mailing Address: P O Box 578, Granger, TX 76530
- Principal or Admin: Chris Buerger
- Fax: (512) 859-2446
- Website: www.esc13.net
School Operational Details
- Title I EligibleAll students of this school are eligible for participation in authorized programs.
School District Details
- Granger Independent School District (ISD)
- Per-Pupil Spending: $8,934
- Graduation Rate: 95.6%
- Students Per Teacher: 10.1
- Enrolled Students: 427
Faculty Details and Student Enrollment
Students and Faculty
- Total Students Enrolled: 427
- Total Full Time "Equivalent" Teachers: 42.4
- Average Student-To-Teacher Ratio: 10.1
Students Gender Breakdown
- Males: 242 (56.7%)
- Females: 185 (43.3%)
Free Lunch Student Eligibility Breakdown
- Eligible for Reduced Lunch: 54 (12.6%)
- Eligible for Free Lunch: 194 (45.4%)
- Eligible for Either Reduced or Free Lunch: 248 (58.1%)
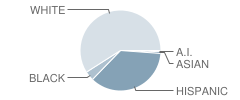
Student Enrollment Distribution by Race / Ethnicity
| Number | Percent | |
|---|---|---|
| American Indian | 2 | 0.5% |
| Black | 16 | 3.7% |
| Asian | 3 | 0.7% |
| Hispanic | 154 | 36.1% |
| White | 252 | 59.0% |
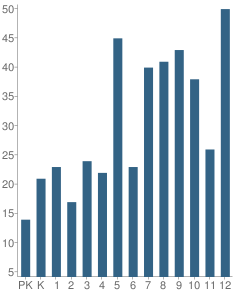
Number of Students Per Grade
| Number | Percent | |
|---|---|---|
| Pre-Kindergarten | 14 | 3.3% |
| Kindergarten | 21 | 4.9% |
| 1st Grade | 23 | 5.4% |
| 2nd Grade | 17 | 4.0% |
| 3rd Grade | 24 | 5.6% |
| 4th Grade | 22 | 5.2% |
| 5th Grade | 45 | 10.5% |
| 6th Grade | 23 | 5.4% |
| 7th Grade | 40 | 9.4% |
| 8th Grade | 41 | 9.6% |
| 9th Grade | 43 | 10.1% |
| 10th Grade | 38 | 8.9% |
| 11th Grade | 26 | 6.1% |
| 12th Grade | 50 | 11.7% |
Breakdown of College Ready Graduates (2009)
Percent Ready For College in Reading
School:
69.0%
District:
69.0%
State:
62.0%
Percent Ready For College in Math
School:
58.0%
District:
20.0%
State:
60.0%
Graduation & Dropout Rates (2009)
Graduation Rate
School:
88.6%
District:
88.6%
State:
80.6%
Dropout Rate
School:
4.5%
District:
4.5%
State:
9.4%
Faculty Breakdown (2010)
Average Teacher Experience
School:
9.4
District:
9.4
State:
11.3
Percent of Teachers With 1-5 Years Experience
School:
40.1%
District:
40.1%
State:
31.0%
Percent of Teachers With 6-10 Years Experience
School:
14.1%
District:
14.1%
State:
20.3%
Percent of Teachers With 11-20 Years Experience
School:
30.6%
District:
30.6%
State:
24.4%
Percent of Teachers With Greater Than 20 Years Experience
School:
12.8%
District:
12.8%
State:
18.3%
Faculty Salary (2010)
School Administration Average Base Salary
School:
$60,980
District:
$60,980
State:
$70,209
Teacher Average Base Salary
School:
$38,742
District:
$38,742
State:
$48,263
Beginning Teacher Average Base Salary
School:
$30,492
District:
$30,492
State:
$41,165
Teacher With 1-5 Years Experience Average Base Salary
School:
$32,722
State:
$43,527
Teacher With 6-10 Years Experience Average Base Salary
School:
$38,126
State:
$46,149
Teacher With 11-20 Years Experience Average Base Salary
School:
$43,007
State:
$50,153
Teacher With Greater Than 20 Years Experience Average Base Salary
School:
$49,601
State:
$58,427
Source: TX Department of Education, Source: NCES 2009-2010
School Ratings and Reviews
Be The First To Review Granger School!
School Map and Similar Schools Nearby
Click to Activate Map of Nearby School Campuses
Private
Public
This School
Similar Schools Nearby
| Bartlett High School PK-12 | 388 Students | 5.5 miles away | Not Yet Rated | |
| Taylor High School 9-12 | 896 Students | 8.8 miles away | Not Yet Rated | |
| Holland High School 9-12 | 125 Students | 11.2 miles away | Not Yet Rated | |
| Thrall High School 9-12 | 187 Students | 12.3 miles away | Not Yet Rated | |
| Jarrell High School 9-12 | 258 Students | 13.1 miles away | Not Yet Rated | |
| Thorndale High School 9-12 | 200 Students | 15.4 miles away | Not Yet Rated | |
| Salado Junior High School 7-8 | 213 Students | 16.9 miles away | Not Yet Rated | |
| Salado High School 9-12 | 466 Students | 17.5 miles away | Not Yet Rated | |
| Academy High School 9-12 | 315 Students | 18.9 miles away | Not Yet Rated | |
| Rogers High School 9-12 | 260 Students | 18.9 miles away | Not Yet Rated | |
Compare This School To Nearby Schools ->
School Community Forum

Join a discussion about Granger School and talk to others in the community including students, parents, teachers, and administrators.
Popular Discussion Topics
- Admissions and Registration Questions (e.g. Dress Code and Discipline Policy)
- School Calendar and Upcoming Events (e.g. Graduation)
- After School Programs, Extracurricular Activities, and Athletics (e.g. Football)
- News and Announcements (e.g. Yearbook and Class Supply List Details)
- Graduate and Alumni Events (e.g. Organizing Class Reunions)
Navigation
Can't Find What You Are Looking For?
Nearby Cities
Sponsored Links
K-12 Articles

Grammar...not Just Extended Family Anymore!
Can I talk to y'all abit about grammar? Right grammar and punctuations got to be some of the...
Can I talk to y'all abit about grammar? Right grammar and punctuations got to be some of the...

The Adolescent Monster
"What happened to my sweet little baby?" Every parent has or will ask that sometime during the...
"What happened to my sweet little baby?" Every parent has or will ask that sometime during the...

Teaching Children with Learning Disabilities to Make Friends
Children with learning disabilities often have trouble making and retaining friendships. Some kids...
Children with learning disabilities often have trouble making and retaining friendships. Some kids...