Martin Luther King, Jr., Middle School
Rating
Not Available
Not Available

No Reviews Yet
Find Old Friends From Martin Luther King, Jr., Middle School
Use the form below to search for alumni from Martin Luther King, Jr., Middle School.
School Description
School Summary and Highlights
- Enrolls 561 middle school students from grades 7-8
- Ranks 1159th out of 2,050 middle schools in CA.
- 2010 Overall School AYP Met Status: Yes
Additional Contact Information
- Mailing Address: PO Box 5000, Hayward, CA 94540
School Operational Details
- Title I EligibleAll students of this school are eligible for participation in authorized programs.
School District Details
- Hayward Unified School District
- Per-Pupil Spending: $9,589
- Graduation Rate: 69.4%
- Dropout Rate: 4.7%
- Students Per Teacher: 22.1
- Enrolled Students: 20,965
Faculty Details and Student Enrollment
Students and Faculty
- Total Students Enrolled: 561
- Total Full Time "Equivalent" Teachers: 25.0
- Average Student-To-Teacher Ratio: 22.4
Students Gender Breakdown
- Males: 294 (52.4%)
- Females: 267 (47.6%)
Free Lunch Student Eligibility Breakdown
- Eligible for Reduced Lunch: 67 (11.9%)
- Eligible for Free Lunch: 335 (59.7%)
- Eligible for Either Reduced or Free Lunch: 402 (71.7%)
Student Enrollment Distribution by Race / Ethnicity
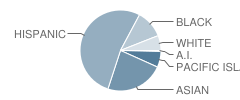
| Number | Percent | |
|---|---|---|
| American Indian | 3 | 0.5% |
| Black | 63 | 11.2% |
| Asian | 130 | 23.2% |
| Hispanic | 293 | 52.2% |
| White | 34 | 6.1% |
Number of Students Per Grade
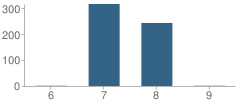
| Number | Percent | |
|---|---|---|
| 6th Grade | 1 | 0.2% |
| 7th Grade | 316 | 56.3% |
| 8th Grade | 243 | 43.3% |
| 9th Grade | 1 | 0.2% |
Teacher Education Background (2009)
Percent With Ph.D.
School:
3.6%
District:
5.1%
Percent With Master's Degree
School:
17.9%
District:
46.5%
Percent With Bachelor's Degree
School:
10.7%
District:
10.1%
Teacher Credentials & Experience (2009)
Percent of Teachers With Emergency Credentials: 4.2%
Percent of Teachers With Credentials: 100.0%
Number of Certificated Staff: 28.0
Average Number of Years of Teacher Experience: 13.1
Average Age
School:
45.9
District:
49.3
Source: CA Department of Education, Source: NCES 2009-2010
School Ratings and Reviews
Be The First To Review Martin Luther King, Jr., Middle School!
School Map and Similar Schools Nearby
Click to Activate Map of Nearby School Campuses
Private
Public
This School
Similar Schools Nearby
| Southgate Elementary School KG-6 | 647 Students | 0.3 miles away |  4 out of 5 | |
| Eldridge Elementary School KG-6 | 619 Students | 0.4 miles away | Not Yet Rated | |
| Schafer Park Elementary School KG-6 | 510 Students | 0.6 miles away | Not Yet Rated | |
| Palma Ceia Elementary School KG-6 | 597 Students | 0.7 miles away | Not Yet Rated | |
| Lorin A. Eden Elementary School KG-6 | 522 Students | 0.8 miles away |  5 out of 5 | |
| Eden Gardens Elementary School KG-6 | 576 Students | 0.8 miles away | 5 out of 5 | |
| Anthony W. Ochoa Middle School 7-8 | 678 Students | 1.0 miles away | 5 out of 5 | |
| Harder Elementary School KG-6 | 668 Students | 1.6 miles away |  2 out of 5 | |
| Cesar Chavez Middle School 7-8 | 616 Students | 1.6 miles away | 5 out of 5 | |
| Bowman Elementary School KG-6 | 545 Students | 1.7 miles away | 5 out of 5 | |
Compare This School To Nearby Schools ->
School Community Forum

Join a discussion about Martin Luther King, Jr., Middle School and talk to others in the community including students, parents, teachers, and administrators.
Popular Discussion Topics
- Admissions and Registration Questions (e.g. Dress Code and Discipline Policy)
- School Calendar and Upcoming Events (e.g. Graduation)
- After School Programs, Extracurricular Activities, and Athletics (e.g. Football)
- News and Announcements (e.g. Yearbook and Class Supply List Details)
- Graduate and Alumni Events (e.g. Organizing Class Reunions)
Navigation
Can't Find What You Are Looking For?
Rankings
Nearby Cities
Sponsored Links
K-12 Articles

A Cheat Sheet on Cheating
Senior projects are coming due and finals are coming up. Spring has sprung, and with spring comes...
Senior projects are coming due and finals are coming up. Spring has sprung, and with spring comes...

Siblings and Individual Identity in High School
When the first day of high school looms in the near future, teens are both excited and anxious....
When the first day of high school looms in the near future, teens are both excited and anxious....

Helping Your Learning Disabled Child
Thousands of children in America struggle to learn on a daily basis. Many of them have invisible...
Thousands of children in America struggle to learn on a daily basis. Many of them have invisible...