Hardin High School
Rating
Not Available
Not Available

5 out of 5 | 1 Review
Find Old Friends From Hardin High School
Use the form below to search for alumni from Hardin High School.
School Description
School Summary and Highlights
- Enrolls 360 high school students from grades 9-12
- Ranks 931st out of 1,325 high schools in TX.
- 2010 Overall School AYP Met Status: Yes
Additional Contact Information
- Mailing Address: P O Box 330, Hardin, TX 77561
- Principal or Admin: Dr D'ann Cathriner
- Fax: (936) 298-3612
- Website: www.hardin.isd.esc4.net
School District Details
- Hardin Independent School District (ISD)
- Per-Pupil Spending: $8,359
- Graduation Rate: 79.8%
- Dropout Rate: 2.1%
- Students Per Teacher: 13.2
- Enrolled Students: 1,243
Faculty Details and Student Enrollment
Students and Faculty
- Total Students Enrolled: 360
- Total Full Time "Equivalent" Teachers: 30.0
- Average Student-To-Teacher Ratio: 12.0
Students Gender Breakdown
- Males: 177 (49.2%)
- Females: 183 (50.8%)
Free Lunch Student Eligibility Breakdown
- Eligible for Reduced Lunch: 27 (7.5%)
- Eligible for Free Lunch: 128 (35.6%)
- Eligible for Either Reduced or Free Lunch: 155 (43.1%)
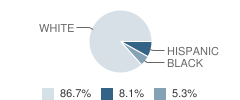
Student Enrollment Distribution by Race / Ethnicity
| Number | Percent | |
|---|---|---|
| American Indian | - | - |
| Black | 19 | 5.3% |
| Asian | - | - |
| Hispanic | 29 | 8.1% |
| White | 312 | 86.7% |
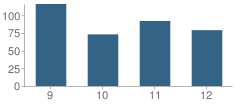
Number of Students Per Grade
| Number | Percent | |
|---|---|---|
| 9th Grade | 116 | 32.2% |
| 10th Grade | 73 | 20.3% |
| 11th Grade | 92 | 25.6% |
| 12th Grade | 79 | 21.9% |
Breakdown of College Ready Graduates (2009)
Percent Ready For College in Reading
School:
45.0%
District:
45.0%
State:
62.0%
Percent Ready For College in Math
School:
50.0%
District:
42.0%
State:
60.0%
Graduation & Dropout Rates (2009)
Graduation Rate
School:
85.5%
District:
85.5%
State:
80.6%
Dropout Rate
School:
6.6%
District:
6.6%
State:
9.4%
Faculty Salary (2010)
School Administration Average Base Salary
School:
$72,421
District:
$62,338
State:
$70,209
Teacher Average Base Salary
School:
$45,564
District:
$44,857
State:
$48,263
Beginning Teacher Average Base Salary
School:
$36,390
District:
$38,332
State:
$41,165
Teacher With 1-5 Years Experience Average Base Salary
School:
$38,709
State:
$43,527
Teacher With 6-10 Years Experience Average Base Salary
School:
$41,340
State:
$46,149
Teacher With 11-20 Years Experience Average Base Salary
School:
$50,919
State:
$50,153
Teacher With Greater Than 20 Years Experience Average Base Salary
School:
$51,959
State:
$58,427
Faculty Breakdown (2010)
Average Teacher Experience
School:
13.0
District:
13.9
State:
11.3
Percent of Teachers With 1-5 Years Experience
School:
25.5%
District:
26.6%
State:
31.0%
Percent of Teachers With 6-10 Years Experience
School:
6.7%
District:
17.0%
State:
20.3%
Percent of Teachers With 11-20 Years Experience
School:
22.9%
District:
17.9%
State:
24.4%
Percent of Teachers With Greater Than 20 Years Experience
School:
31.6%
District:
32.1%
State:
18.3%
Source: TX Department of Education, Source: NCES 2009-2010
School Ratings and Reviews
Overall Rating: 5

5 out of 5 | 1 Review
The Overall Rating is the school's average rating from parents, students, school faculty and staff. The highest rating is five apples and the lowest is one apple.
Share Your Review About This School
1 review for Hardin High School
- Reviewed by Student on August 04, 2009
- Rating:
 (5 / 5) Flag as inappropriate
 - Hardin High School has really stepped up its game for the '09-'10 school year I must say as an upcoming freshman. In order to get into the Honors Classes, you must take placement tests, have teacher reccomendation, good grades, and over all good TAKS scores. Hardin is back with a bang! (:
-Student
School Map and Similar Schools Nearby
Click to Activate Map of Nearby School Campuses
Private
Public
This School
Similar Schools Nearby
| Hardin Junior High School 7-8 | 199 Students | 0.06 miles away | Not Yet Rated | |
| Hull-Daisetta High School 9-12 | 164 Students | 6.1 miles away |  3 out of 5 | |
| Hull-Daisetta Junior High School 7-8 | 75 Students | 6.1 miles away | Not Yet Rated | |
| Adaptive Behavior Unit School 7-9 | 2 Students | 6.2 miles away | Not Yet Rated | - |
| Liberty High School 9-12 | 634 Students | 6.6 miles away |  4 out of 5 | |
| Dayton High School 8-12 | 1,400 Students | 11.9 miles away |  4.5 out of 5 | |
| Wilson Junior High School 7-8 | 761 Students | 12.5 miles away | Not Yet Rated | |
| West Hardin High School 9-12 | 167 Students | 12.5 miles away | 4 out of 5 | |
| Tarkington High School 9-12 | 615 Students | 17.2 miles away | Not Yet Rated | |
| Devers Junior High School 6-8 | 53 Students | 18.2 miles away | Not Yet Rated | |
Compare This School To Nearby Schools ->
School Community Forum

Join a discussion about Hardin High School and talk to others in the community including students, parents, teachers, and administrators.
Popular Discussion Topics
- Admissions and Registration Questions (e.g. Dress Code and Discipline Policy)
- School Calendar and Upcoming Events (e.g. Graduation)
- After School Programs, Extracurricular Activities, and Athletics (e.g. Football)
- News and Announcements (e.g. Yearbook and Class Supply List Details)
- Graduate and Alumni Events (e.g. Organizing Class Reunions)
Navigation
Can't Find What You Are Looking For?
Nearby Cities
Sponsored Links
K-12 Articles

Parent and Family Involvement in School
When visiting my grandson’s school, I often hear administrators and teachers complaining that not...
When visiting my grandson’s school, I often hear administrators and teachers complaining that not...

Just a Harmless Vanilla Bean?
Some of the greatest, most used, and most profitable breakthroughs in science have not been made by...
Some of the greatest, most used, and most profitable breakthroughs in science have not been made by...

Middle School Homework and Study Habits
The report cards came home and you’re disappointed with your child’s scores. You know he has the...
The report cards came home and you’re disappointed with your child’s scores. You know he has the...