Mccollum High School
500 West Formosa Blvd, San Antonio, TX 78221 | (210) 989-1500
- Grades: 9-12
- Student Enrollment: 1,695
Rating
Not Available
Not Available

No Reviews Yet
Find Old Friends From Mccollum High School
Use the form below to search for alumni from Mccollum High School.
School Description
School Summary and Highlights
- Enrolls 1,695 high school students from grades 9-12
- Ranks 1126th out of 1,325 high schools in TX.
- 2010 Overall School AYP Met Status: Yes
Additional Contact Information
- Mailing Address: 500 W Formosa Blvd, San Antonio, TX 78221
- Principal or Admin: Mr David Stelmazewski
- Fax: (210) 921-9673
- Website: www.harlandale.k12.tx.us
School Operational Details
- Title I EligibleAll students of this school are eligible for participation in authorized programs.
School District Details
- Harlandale Independent School District (ISD)
- Per-Pupil Spending: $8,594
- Graduation Rate: 64.1%
- Dropout Rate: 3.5%
- Students Per Teacher: 14.9
- Enrolled Students: 14,521
Faculty Details and Student Enrollment
Students and Faculty
- Total Students Enrolled: 1,695
- Total Full Time "Equivalent" Teachers: 118.8
- Average Student-To-Teacher Ratio: 14.3
Students Gender Breakdown
- Males: 840 (49.6%)
- Females: 855 (50.4%)
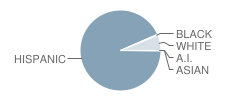
Student Enrollment Distribution by Race / Ethnicity
| Number | Percent | |
|---|---|---|
| American Indian | 2 | 0.1% |
| Black | 7 | 0.4% |
| Asian | 2 | 0.1% |
| Hispanic | 1,580 | 93.2% |
| White | 104 | 6.1% |
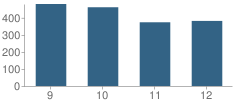
Number of Students Per Grade
| Number | Percent | |
|---|---|---|
| 9th Grade | 480 | 28.3% |
| 10th Grade | 461 | 27.2% |
| 11th Grade | 373 | 22.0% |
| 12th Grade | 381 | 22.5% |
Breakdown of College Ready Graduates (2009)
Percent Ready For College in Reading
School:
59.0%
District:
56.0%
State:
62.0%
Percent Ready For College in Math
School:
48.0%
District:
39.0%
State:
60.0%
Graduation & Dropout Rates (2009)
Graduation Rate
School:
82.1%
District:
75.7%
State:
80.6%
Dropout Rate
School:
10.9%
District:
11.0%
State:
9.4%
Faculty Salary (2010)
School Administration Average Base Salary
School:
$70,858
District:
$68,917
State:
$70,209
Teacher Average Base Salary
School:
$48,488
District:
$49,015
State:
$48,263
Beginning Teacher Average Base Salary
School:
$48,447
District:
$46,300
State:
$41,165
Teacher With 1-5 Years Experience Average Base Salary
School:
$44,725
State:
$43,527
Teacher With 6-10 Years Experience Average Base Salary
School:
$45,610
State:
$46,149
Teacher With 11-20 Years Experience Average Base Salary
School:
$49,113
State:
$50,153
Teacher With Greater Than 20 Years Experience Average Base Salary
School:
$59,238
State:
$58,427
Faculty Breakdown (2010)
Average Teacher Experience
School:
10.1
District:
11.6
State:
11.3
Percent of Teachers With 1-5 Years Experience
School:
40.2%
District:
31.3%
State:
31.0%
Percent of Teachers With 6-10 Years Experience
School:
13.9%
District:
17.2%
State:
20.3%
Percent of Teachers With 11-20 Years Experience
School:
20.2%
District:
23.1%
State:
24.4%
Percent of Teachers With Greater Than 20 Years Experience
School:
16.7%
District:
19.7%
State:
18.3%
Source: TX Department of Education, Source: NCES 2009-2010
School Ratings and Reviews
Be The First To Review Mccollum High School!
School Map and Similar Schools Nearby
Click to Activate Map of Nearby School Campuses
Private
Public
This School
Similar Schools Nearby
| Harlandale High School 9-12 | 1,886 Students | 1.6 miles away | Not Yet Rated | |
| South San Antonio High School 9-12 | 2,254 Students | 2.0 miles away | Not Yet Rated | |
| Burbank High School 9-12 | 1,495 Students | 3.4 miles away |  5 out of 5 | |
| Brackenridge High School 9-12 | 1,818 Students | 4.5 miles away |  4 out of 5 | |
| John F Kennedy High School 9-12 | 1,580 Students | 4.7 miles away | 5 out of 5 | |
| Highlands High School 9-12 | 2,121 Students | 5.2 miles away | 5 out of 5 | |
| Lanier High School 9-12 | 1,350 Students | 5.5 miles away | 5 out of 5 | |
| Fox Technical High School 9-12 | 1,338 Students | 6.4 miles away | Not Yet Rated | |
| Sharon Christa Mcauliffe Junior High School 6-8 | 878 Students | 6.6 miles away | 5 out of 5 | |
| Virginia Allred Stacey High School (Junior / Senior) 7-12 | 255 Students | 7.1 miles away | Not Yet Rated | |
Compare This School To Nearby Schools ->
School Community Forum

Join a discussion about Mccollum High School and talk to others in the community including students, parents, teachers, and administrators.
Popular Discussion Topics
- Admissions and Registration Questions (e.g. Dress Code and Discipline Policy)
- School Calendar and Upcoming Events (e.g. Graduation)
- After School Programs, Extracurricular Activities, and Athletics (e.g. Football)
- News and Announcements (e.g. Yearbook and Class Supply List Details)
- Graduate and Alumni Events (e.g. Organizing Class Reunions)
Navigation
Can't Find What You Are Looking For?
Nearby Cities
Sponsored Links
K-12 Articles

Keep Morning Stress at a Minimum: Establish a Routine
Morning! It can be a time of stress. The kids are fighting over who gets to use the bathroom first,...
Morning! It can be a time of stress. The kids are fighting over who gets to use the bathroom first,...

Cell Phones... the Best Thing Since Sliced Bread or the Worst Invention in the World?
Cell phones are wonderful, the best things humans have ever invented! They help us keep in touch...
Cell phones are wonderful, the best things humans have ever invented! They help us keep in touch...

Teaching Children with Learning Disabilities to Make Friends
Children with learning disabilities often have trouble making and retaining friendships. Some kids...
Children with learning disabilities often have trouble making and retaining friendships. Some kids...