Higgins School
Rating
Not Available
Not Available

No Reviews Yet
Find Old Friends From Higgins School
Use the form below to search for alumni from Higgins School.
School Description
School Summary and Highlights
- Enrolls 94 school students from grades PK-12
- Ranks 1250th out of 1,325 high schools in TX.
- 2010 Overall School AYP Met Status: Yes
Additional Contact Information
- Mailing Address: PO Box 218, Higgins, TX 79046
- Principal or Admin: Mrs Hope Appel
- Fax: (806) 852-3502
School Operational Details
- Title I EligibleAll students of this school are eligible for participation in authorized programs.
School District Details
- Higgins Independent School District (ISD)
- Per-Pupil Spending: $15,980
- Graduation Rate: 85.7%
- Students Per Teacher: 5.4
- Enrolled Students: 94
Faculty Details and Student Enrollment
Students and Faculty
- Total Students Enrolled: 94
- Total Full Time "Equivalent" Teachers: 17.5
- Average Student-To-Teacher Ratio: 5.4
Students Gender Breakdown
- Males: 44 (46.8%)
- Females: 50 (53.2%)
Free Lunch Student Eligibility Breakdown
- Eligible for Reduced Lunch: 19 (20.2%)
- Eligible for Free Lunch: 48 (51.1%)
- Eligible for Either Reduced or Free Lunch: 67 (71.3%)
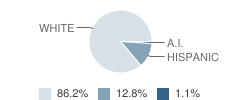
Student Enrollment Distribution by Race / Ethnicity
| Number | Percent | |
|---|---|---|
| American Indian | 1 | 1.1% |
| Black | - | - |
| Asian | - | - |
| Hispanic | 12 | 12.8% |
| White | 81 | 86.2% |
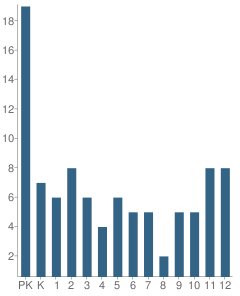
Number of Students Per Grade
| Number | Percent | |
|---|---|---|
| Pre-Kindergarten | 19 | 20.2% |
| Kindergarten | 7 | 7.4% |
| 1st Grade | 6 | 6.4% |
| 2nd Grade | 8 | 8.5% |
| 3rd Grade | 6 | 6.4% |
| 4th Grade | 4 | 4.3% |
| 5th Grade | 6 | 6.4% |
| 6th Grade | 5 | 5.3% |
| 7th Grade | 5 | 5.3% |
| 8th Grade | 2 | 2.1% |
| 9th Grade | 5 | 5.3% |
| 10th Grade | 5 | 5.3% |
| 11th Grade | 8 | 8.5% |
| 12th Grade | 8 | 8.5% |
Breakdown of College Ready Graduates (2009)
Percent Ready For College in Reading
School:
75.0%
District:
75.0%
State:
62.0%
Percent Ready For College in Math
School:
63.0%
State:
60.0%
Graduation & Dropout Rates (2009)
Graduation Rate
School:
88.9%
District:
88.9%
State:
80.6%
Faculty Breakdown (2010)
Average Teacher Experience
School:
13.5
District:
13.5
State:
11.3
Percent of Teachers With 1-5 Years Experience
School:
20.5%
District:
20.5%
State:
31.0%
Percent of Teachers With 6-10 Years Experience
School:
22.8%
District:
22.8%
State:
20.3%
Percent of Teachers With 11-20 Years Experience
School:
5.3%
District:
5.3%
State:
24.4%
Percent of Teachers With Greater Than 20 Years Experience
School:
40.0%
District:
40.0%
State:
18.3%
Faculty Salary (2010)
School Administration Average Base Salary
School:
$43,300
District:
$43,300
State:
$70,209
Teacher Average Base Salary
School:
$44,015
District:
$44,015
State:
$48,263
Beginning Teacher Average Base Salary
School:
$37,255
District:
$37,255
State:
$41,165
Teacher With 1-5 Years Experience Average Base Salary
School:
$33,992
State:
$43,527
Teacher With 6-10 Years Experience Average Base Salary
School:
$38,825
State:
$46,149
Teacher With 11-20 Years Experience Average Base Salary
School:
$80,000
State:
$50,153
Teacher With Greater Than 20 Years Experience Average Base Salary
School:
$49,263
State:
$58,427
Source: TX Department of Education, Source: NCES 2009-2010
School Ratings and Reviews
Be The First To Review Higgins School!
School Map and Similar Schools Nearby
Click to Activate Map of Nearby School Campuses
Private
Public
This School
Similar Schools Nearby
| Follett School PK-12 | 173 Students | 22.4 miles away | Not Yet Rated | |
| Canadian High School 9-12 | 195 Students | 25.0 miles away | Not Yet Rated | |
| Darrouzett Elementary School PK-12 | 132 Students | 28.0 miles away | Not Yet Rated | |
Compare This School To Nearby Schools ->
Navigation
Can't Find What You Are Looking For?
Nearby Cities
Sponsored Links
K-12 Articles

Attend Your Teen's Holiday Parties
Christmas and New Years are coming, and with them Christmas and New Years Eve parties. At many of...
Christmas and New Years are coming, and with them Christmas and New Years Eve parties. At many of...

Help Your Child Achieve Success in Middle School
Middle school is for children between the ages of 10 and 14 years. At this time children begin to...
Middle school is for children between the ages of 10 and 14 years. At this time children begin to...

Teaching Children with Learning Disabilities to Make Friends
Children with learning disabilities often have trouble making and retaining friendships. Some kids...
Children with learning disabilities often have trouble making and retaining friendships. Some kids...