Tennyson High School

4 out of 5 | 5 Reviews
Find Old Friends From Tennyson High School
Use the form below to search for alumni from Tennyson High School.
School Description
School Summary and Highlights
- Enrolls 1,447 high school students from grades 9-12
- Ranks 1030th out of 1,197 high schools in CA.
- 2010 Overall School AYP Met Status: No
Additional Contact Information
- Mailing Address: PO Box 5000, Hayward, CA 94540
School District Details
- Hayward Unified School District
- Per-Pupil Spending: $9,589
- Graduation Rate: 69.4%
- Dropout Rate: 4.7%
- Students Per Teacher: 22.1
- Enrolled Students: 20,965
Faculty Details and Student Enrollment
Students and Faculty
- Total Students Enrolled: 1,447
- Total Full Time "Equivalent" Teachers: 67.4
- Average Student-To-Teacher Ratio: 21.5
Students Gender Breakdown
- Males: 736 (50.9%)
- Females: 711 (49.1%)
Free Lunch Student Eligibility Breakdown
- Eligible for Reduced Lunch: 130 (9.0%)
- Eligible for Free Lunch: 875 (60.5%)
- Eligible for Either Reduced or Free Lunch: 1,005 (69.5%)
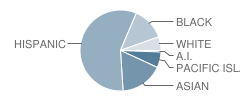
Student Enrollment Distribution by Race / Ethnicity

| Number | Percent | |
|---|---|---|
| American Indian | 12 | 0.8% |
| Black | 191 | 13.2% |
| Asian | 247 | 17.1% |
| Hispanic | 820 | 56.7% |
| White | 81 | 5.6% |
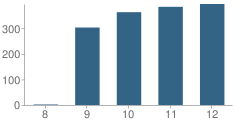
Number of Students Per Grade

| Number | Percent | |
|---|---|---|
| 8th Grade | 2 | 0.1% |
| 9th Grade | 303 | 20.9% |
| 10th Grade | 363 | 25.1% |
| 11th Grade | 384 | 26.5% |
| 12th Grade | 395 | 27.3% |
Graduates Information (2010)
Graduation Rate
School:
76.7%
District:
77.5%
State:
78.6%
Teacher Education Background (2009)
Percent With Ph.D.
School:
1.1%
District:
5.1%
Percent With Master's Degree
School:
22.7%
District:
46.5%
Percent With Bachelor's Degree
School:
8.0%
District:
10.1%
Teacher Credentials & Experience (2009)
Percent of Teachers With Emergency Credentials: 5.0%
Percent of Teachers With Credentials: 98.8%
Number of Certificated Staff: 88.0
Average Number of Years of Teacher Experience: 10.9
Average Age
School:
43.5
District:
49.3
Source: CA Department of Education, Source: NCES 2009-2010
Sponsored Links
Test Scores and Performance Information
Overall School Rating
How is this determined?
The overall school rating shows that Tennyson High School performed on average worse than many other schools across the state on CST state exams in the following subjects:
- CST Algebra I
- CST Algebra II
- CST Biology
- CST Chemistry
- CST English-Language Arts
- CST General Mathematics
- CST Geometry
- CST Integrated/Coordinated Science
- CST Physics
- CST Science
- CST Summative High School Math
- CST U.S. History
- CST World History
AYP Results (2010)
Overall AYP Met: No
ELA AYP Met: No
Math AYP Met: No
ACT Exam Results (2009)
Percent of Students Taking ACT Exam: 1.7%
SAT Exam Results (2009)
Percent of Students Taking SAT Exam: 37.6%
Average Combined Score: 1,306.9
Critical Reading Average: 433.6
Math Average: 435.9
Writing Average: 437.4
Percent Scoring At or Above 1500: 23.3%
CST - Test Proficiency by Grade and Subject
Grade 9 - % of students at or above proficiency
| School | District | State | |
|---|---|---|---|
| CST Algebra I Test | |||
| 2010 | 17.0% | 16.0% | 22.0% |
| 2009 | 9.0% | 8.0% | 21.0% |
| 2008 | 6.0% | 10.0% | 18.0% |
| CST English-Language Arts Test | |||
| 2010 | 39.0% | 44.0% | 54.0% |
| 2009 | 31.0% | 40.0% | 50.0% |
| 2008 | 29.0% | 37.0% | 49.0% |
| CST Geometry Test | |||
| 2010 | 25.0% | 18.0% | 46.0% |
| 2009 | 21.0% | 14.0% | 47.0% |
| 2008 | 4.0% | 9.0% | 43.0% |
| CST Physics Test | |||
| 2010 | 6.0% | 6.0% | 40.0% |
| 2009 | 1.0% | 1.0% | 35.0% |
| 2008 | 1.0% | 1.0% | 30.0% |
| CST General Mathematics Test | |||
| 2008 | 7.0% | 3.0% | 18.0% |
Grade 10 - % of students at or above proficiency
| School | District | State | |
|---|---|---|---|
| CST Algebra I Test | |||
| 2010 | 8.0% | 9.0% | 12.0% |
| 2009 | 6.0% | 5.0% | 11.0% |
| 2008 | 4.0% | 7.0% | 9.0% |
| CST Algebra II Test | |||
| 2010 | 10.0% | 21.0% | 40.0% |
| 2009 | 5.0% | 8.0% | 37.0% |
| 2008 | 29.0% | 24.0% | 36.0% |
| CST Biology Test | |||
| 2010 | 19.0% | 17.0% | 38.0% |
| 2009 | 13.0% | 12.0% | 34.0% |
| 2008 | 8.0% | 14.0% | 35.0% |
| CST English-Language Arts Test | |||
| 2010 | 27.0% | 33.0% | 45.0% |
| 2009 | 23.0% | 30.0% | 44.0% |
| 2008 | 28.0% | 31.0% | 41.0% |
| CST Geometry Test | |||
| 2010 | 3.0% | 7.0% | 14.0% |
| 2009 | 7.0% | 2.0% | 14.0% |
| CST Science Test | |||
| 2010 | 29.0% | 31.0% | 46.0% |
| 2009 | 23.0% | 28.0% | 44.0% |
| 2008 | 19.0% | 26.0% | 40.0% |
| CST World History Test | |||
| 2010 | 17.0% | 26.0% | 42.0% |
| 2009 | 11.0% | 19.0% | 38.0% |
| 2008 | 9.0% | 17.0% | 33.0% |
| CST Summative High School Math Test | |||
| 2009 | 48.0% | 38.0% | 71.0% |
| 2008 | 73.0% | 46.0% | 68.0% |
| CST Chemistry Test | |||
| 2008 | 9.0% | 17.0% | 41.0% |
| CST Integrated/Coordinated Science Test | |||
| 2008 | 2.0% | 2.0% | 7.0% |
Grade 11 - % of students at or above proficiency
| School | District | State | |
|---|---|---|---|
| CST Algebra I Test | |||
| 2010 | 20.0% | 8.0% | 8.0% |
| 2009 | 2.0% | 4.0% | 8.0% |
| 2008 | 6.0% | 4.0% | 5.0% |
| CST Algebra II Test | |||
| 2010 | 4.0% | 3.0% | 14.0% |
| 2009 | 6.0% | 3.0% | 12.0% |
| 2008 | 4.0% | 6.0% | 11.0% |
| CST Biology Test | |||
| 2010 | 21.0% | 32.0% | 46.0% |
| 2009 | 20.0% | 33.0% | 41.0% |
| 2008 | 25.0% | 34.0% | 39.0% |
| CST Chemistry Test | |||
| 2010 | 13.0% | 9.0% | 30.0% |
| 2009 | 9.0% | 6.0% | 27.0% |
| CST English-Language Arts Test | |||
| 2010 | 26.0% | 29.0% | 42.0% |
| 2009 | 26.0% | 28.0% | 40.0% |
| 2008 | 20.0% | 23.0% | 37.0% |
| CST Geometry Test | |||
| 2010 | 3.0% | 3.0% | 6.0% |
| 2009 | 1.0% | 1.0% | 7.0% |
| 2008 | 2.0% | 1.0% | 6.0% |
| CST Integrated/Coordinated Science Test | |||
| 2010 | 4.0% | 3.0% | 8.0% |
| 2009 | 4.0% | 4.0% | 11.0% |
| 2008 | 2.0% | 1.0% | 10.0% |
| CST Summative High School Math Test | |||
| 2010 | 20.0% | 18.0% | 50.0% |
| 2009 | 36.0% | 25.0% | 47.0% |
| 2008 | 9.0% | 19.0% | 43.0% |
| CST U.S. History Test | |||
| 2010 | 17.0% | 29.0% | 45.0% |
| 2009 | 22.0% | 25.0% | 44.0% |
| 2008 | 17.0% | 21.0% | 38.0% |
| CST Physics Test | |||
| 2009 | 13.0% | 16.0% | 50.0% |
| 2008 | 6.0% | 8.0% | 47.0% |
| CST World History Test | |||
| 2009 | 9.0% | 8.0% | 11.0% |
| 2008 | 4.0% | 7.0% | 9.0% |
End of Course - % of students at or above proficiency
| School | District | State | |
|---|---|---|---|
| CST Algebra I Test | |||
| 2010 | 15.0% | 20.0% | 31.0% |
| 2009 | 7.0% | 15.0% | 28.0% |
| 2008 | 5.0% | 16.0% | 25.0% |
| CST Algebra II Test | |||
| 2010 | 8.0% | 17.0% | 31.0% |
| 2009 | 8.0% | 9.0% | 28.0% |
| 2008 | 17.0% | 14.0% | 27.0% |
| CST Biology Test | |||
| 2010 | 20.0% | 27.0% | 46.0% |
| 2009 | 15.0% | 24.0% | 42.0% |
| 2008 | 12.0% | 22.0% | 42.0% |
| CST Chemistry Test | |||
| 2010 | 13.0% | 18.0% | 38.0% |
| 2009 | 9.0% | 12.0% | 36.0% |
| 2008 | 7.0% | 12.0% | 32.0% |
| CST Geometry Test | |||
| 2010 | 9.0% | 17.0% | 27.0% |
| 2009 | 10.0% | 10.0% | 26.0% |
| 2008 | 2.0% | 6.0% | 24.0% |
| CST Integrated/Coordinated Science Test | |||
| 2010 | 5.0% | 4.0% | 16.0% |
| 2009 | 4.0% | 11.0% | 13.0% |
| 2008 | 2.0% | 7.0% | 11.0% |
| CST Physics Test | |||
| 2010 | 5.0% | 12.0% | 49.0% |
| 2009 | 3.0% | 5.0% | 46.0% |
| 2008 | 2.0% | 2.0% | 43.0% |
| CST Summative High School Math Test | |||
| 2010 | 27.0% | 23.0% | 54.0% |
| 2009 | 38.0% | 27.0% | 50.0% |
| 2008 | 20.0% | 26.0% | 47.0% |
| CST World History Test | |||
| 2010 | 16.0% | 25.0% | 41.0% |
| 2009 | 11.0% | 18.0% | 38.0% |
| 2008 | 8.0% | 15.0% | 33.0% |
| CST General Mathematics Test | |||
| 2008 | 7.0% | 2.0% | 27.0% |
Source: CA Department of Education 2009-2010
School Map and Similar Schools Nearby
Click to Activate Map of Nearby School Campuses
Private
Public
This School
Similar Schools Nearby
| Mt. Eden High School 9-12 | 2,003 Students | 1.7 miles away | ![]() 3 out of 5 | |
| Hayward High School 9-12 | 1,694 Students | 2.0 miles away | ![]() 3.5 out of 5 | |
| Refugio M. Cabello Elementary School KG-12 | 54 Students | 3.9 miles away | Not Yet Rated | - |
| James Logan High School 9-12 | 4,150 Students | 4.1 miles away | Not Yet Rated | |
| Castro Valley High School 9-12 | 2,897 Students | 4.4 miles away | Not Yet Rated | |
| San Lorenzo High School 9-12 | 1,451 Students | 4.4 miles away | ![]() 2 out of 5 | |
| Arroyo High School 9-12 | 1,871 Students | 4.7 miles away | Not Yet Rated | |
| American High School 9-12 | 2,071 Students | 6.1 miles away | ![]() 5 out of 5 | |
| Thornton Junior High School 7-8 | 999 Students | 6.6 miles away | Not Yet Rated | |
| San Leandro High School 9-12 | 2,685 Students | 6.6 miles away | ![]() 4.5 out of 5 | |
Compare This School To Nearby Schools ->
School Community Forum

Join a discussion about Tennyson High School and talk to others in the community including students, parents, teachers, and administrators.
Popular Discussion Topics
- Admissions and Registration Questions (e.g. Dress Code and Discipline Policy)
- School Calendar and Upcoming Events (e.g. Graduation)
- After School Programs, Extracurricular Activities, and Athletics (e.g. Football)
- News and Announcements (e.g. Yearbook and Class Supply List Details)
- Graduate and Alumni Events (e.g. Organizing Class Reunions)
Navigation
Can't Find What You Are Looking For?
Rankings
Nearby Cities
Sponsored Links
K-12 Articles
Middle School Homework and Study Habits
The report cards came home and you're disappointed with your child's scores. You know he has the...
Teaching Children Respect
Statistics prove that there are many different family types in today's society. Grandparents or a...
The Cervical Cancer Vaccine
All across North America girls between the ages of 11 and 12 have the opportunity to be vaccinated...


(4 / 5)
(1 / 5)
(5 / 5) 


