Hitchcock High School
Rating
Not Available
Not Available

No Reviews Yet
Find Old Friends From Hitchcock High School
Use the form below to search for alumni from Hitchcock High School.
School Description
School Summary and Highlights
- Enrolls 346 high school students from grades 9-12
- Ranks 1267th out of 1,325 high schools in TX.
- 2010 Overall School AYP Met Status: Yes
Additional Contact Information
- Principal or Admin: Michael Bergman
- Fax: (409) 986-9339
- Website: www.hitchcockisd.org
School Operational Details
- Title I EligibleAll students of this school are eligible for participation in authorized programs.
School District Details
- Hitchcock Independent School District (ISD)
- Per-Pupil Spending: $13,475
- Graduation Rate: 61.0%
- Dropout Rate: 1.7%
- Students Per Teacher: 13.6
- Enrolled Students: 1,200
Faculty Details and Student Enrollment
Students and Faculty
- Total Students Enrolled: 346
- Total Full Time "Equivalent" Teachers: 31.3
- Average Student-To-Teacher Ratio: 11.1
Students Gender Breakdown
- Males: 189 (54.6%)
- Females: 157 (45.4%)
Free Lunch Student Eligibility Breakdown
- Eligible for Reduced Lunch: 23 (6.6%)
- Eligible for Free Lunch: 220 (63.6%)
- Eligible for Either Reduced or Free Lunch: 243 (70.2%)
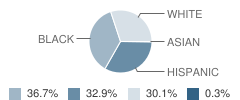
Student Enrollment Distribution by Race / Ethnicity
| Number | Percent | |
|---|---|---|
| American Indian | - | - |
| Black | 127 | 36.7% |
| Asian | 1 | 0.3% |
| Hispanic | 114 | 32.9% |
| White | 104 | 30.1% |
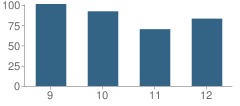
Number of Students Per Grade
| Number | Percent | |
|---|---|---|
| 9th Grade | 101 | 29.2% |
| 10th Grade | 92 | 26.6% |
| 11th Grade | 70 | 20.2% |
| 12th Grade | 83 | 24.0% |
Breakdown of College Ready Graduates (2009)
Percent Ready For College in Reading
School:
38.0%
District:
38.0%
State:
62.0%
Percent Ready For College in Math
School:
44.0%
District:
32.0%
State:
60.0%
Graduation & Dropout Rates (2009)
Graduation Rate
School:
81.9%
District:
80.8%
State:
80.6%
Dropout Rate
School:
13.9%
District:
13.7%
State:
9.4%
Faculty Breakdown (2010)
Average Teacher Experience
School:
12.0
District:
13.0
State:
11.3
Percent of Teachers With 1-5 Years Experience
School:
38.4%
District:
27.6%
State:
31.0%
Percent of Teachers With 6-10 Years Experience
School:
12.8%
District:
15.6%
State:
20.3%
Percent of Teachers With 11-20 Years Experience
School:
24.7%
District:
18.9%
State:
24.4%
Percent of Teachers With Greater Than 20 Years Experience
School:
20.9%
District:
27.9%
State:
18.3%
Faculty Salary (2010)
School Administration Average Base Salary
School:
$92,163
District:
$80,347
State:
$70,209
Teacher Average Base Salary
School:
$47,242
District:
$46,980
State:
$48,263
Beginning Teacher Average Base Salary
School:
$40,906
District:
$40,939
State:
$41,165
Teacher With 1-5 Years Experience Average Base Salary
School:
$41,906
State:
$43,527
Teacher With 6-10 Years Experience Average Base Salary
School:
$43,156
State:
$46,149
Teacher With 11-20 Years Experience Average Base Salary
School:
$49,760
State:
$50,153
Teacher With Greater Than 20 Years Experience Average Base Salary
School:
$57,545
State:
$58,427
Source: TX Department of Education, Source: NCES 2009-2010
School Ratings and Reviews
Be The First To Review Hitchcock High School!
School Map and Similar Schools Nearby
Click to Activate Map of Nearby School Campuses
Private
Public
This School
Similar Schools Nearby
| La Marque High School 7-12 | 961 Students | 3.0 miles away |  1 out of 5 | |
| Santa Fe Junior High School 7-8 | 708 Students | 5.1 miles away | Not Yet Rated | |
| R D Mcadams Junior High School 5-9 | 1,244 Students | 6.8 miles away | Not Yet Rated | |
| Texas City High School 9-12 | 1,621 Students | 7.3 miles away |  5 out of 5 | |
| Santa Fe High School 9-12 | 1,383 Students | 7.6 miles away | Not Yet Rated | |
| Dickinson High School 9-12 | 2,271 Students | 8.1 miles away | Not Yet Rated | |
| Clear Springs High School 9-12 | 2,452 Students | 12.3 miles away | Not Yet Rated | |
| Clear Creek High School 9-12 | 2,460 Students | 12.4 miles away | 5 out of 5 | |
| Fairview Junior High School 6-8 | 648 Students | 13.5 miles away | Not Yet Rated | |
| Ball High School 9-12 | 1,890 Students | 14.0 miles away | 5 out of 5 | |
Compare This School To Nearby Schools ->
School Community Forum

Join a discussion about Hitchcock High School and talk to others in the community including students, parents, teachers, and administrators.
Popular Discussion Topics
- Admissions and Registration Questions (e.g. Dress Code and Discipline Policy)
- School Calendar and Upcoming Events (e.g. Graduation)
- After School Programs, Extracurricular Activities, and Athletics (e.g. Football)
- News and Announcements (e.g. Yearbook and Class Supply List Details)
- Graduate and Alumni Events (e.g. Organizing Class Reunions)
Navigation
Can't Find What You Are Looking For?
Nearby Cities
Sponsored Links
K-12 Articles

Feeling Good in Your Own Skin
Body image is a very touchy issue with today's kids. Since the 1950s, when Barbie was first...
Body image is a very touchy issue with today's kids. Since the 1950s, when Barbie was first...

Is Your Child's Teacher a Bully?
We've all heard about kids being bullied by peers. Kids taunt, tease, pull hair, shove and push...
We've all heard about kids being bullied by peers. Kids taunt, tease, pull hair, shove and push...

Making Sense of No Child Left Behind
The No Child Left Behind Act of 2001 has met with mixed results and mixed feelings. Some think it...
The No Child Left Behind Act of 2001 has met with mixed results and mixed feelings. Some think it...