Furr High School
Rating
Not Available
Not Available

No Reviews Yet
Find Old Friends From Furr High School
Use the form below to search for alumni from Furr High School.
School Description
School Summary and Highlights
- Enrolls 857 high school students from grades 9-12
- Ranks 932nd out of 1,325 high schools in TX.
- 2010 Overall School AYP Met Status: Yes
Additional Contact Information
- Principal or Admin: Dr Bertie Simmons
- Fax: (713) 671-3612
- Website: www.houstonisd.org
School Operational Details
- Title I EligibleAll students of this school are eligible for participation in authorized programs.
School District Details
- Houston Independent School District
- Per-Pupil Spending: $8,604
- Graduation Rate: 56.6%
- Dropout Rate: 6.8%
- Students Per Teacher: 16.9
- Enrolled Students: 202,773
Faculty Details and Student Enrollment
Students and Faculty
- Total Students Enrolled: 857
- Total Full Time "Equivalent" Teachers: 52.1
- Average Student-To-Teacher Ratio: 16.5
Students Gender Breakdown
- Males: 451 (52.6%)
- Females: 406 (47.4%)
Free Lunch Student Eligibility Breakdown
- Eligible for Reduced Lunch: 106 (12.4%)
- Eligible for Free Lunch: 532 (62.1%)
- Eligible for Either Reduced or Free Lunch: 638 (74.4%)
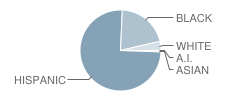
Student Enrollment Distribution by Race / Ethnicity
| Number | Percent | |
|---|---|---|
| American Indian | 1 | 0.1% |
| Black | 177 | 20.7% |
| Asian | 4 | 0.5% |
| Hispanic | 644 | 75.1% |
| White | 31 | 3.6% |
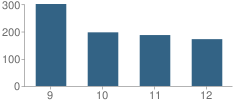
Number of Students Per Grade
| Number | Percent | |
|---|---|---|
| 9th Grade | 301 | 35.1% |
| 10th Grade | 197 | 23.0% |
| 11th Grade | 187 | 21.8% |
| 12th Grade | 172 | 20.1% |
Breakdown of College Ready Graduates (2009)
Percent Ready For College in Reading
School:
33.0%
District:
56.0%
State:
62.0%
Percent Ready For College in Math
School:
37.0%
District:
40.0%
State:
60.0%
Graduation & Dropout Rates (2009)
Graduation Rate
School:
73.9%
District:
70.0%
State:
80.6%
Dropout Rate
School:
9.4%
District:
15.8%
State:
9.4%
Faculty Salary (2010)
School Administration Average Base Salary
School:
$88,573
District:
$78,780
State:
$70,209
Teacher Average Base Salary
School:
$54,905
District:
$52,535
State:
$48,263
Beginning Teacher Average Base Salary
School:
$45,502
District:
$45,070
State:
$41,165
Teacher With 1-5 Years Experience Average Base Salary
School:
$46,310
State:
$43,527
Teacher With 6-10 Years Experience Average Base Salary
School:
$49,536
State:
$46,149
Teacher With 11-20 Years Experience Average Base Salary
School:
$57,671
State:
$50,153
Teacher With Greater Than 20 Years Experience Average Base Salary
School:
$65,389
State:
$58,427
Faculty Breakdown (2010)
Average Teacher Experience
School:
13.9
District:
11.8
State:
11.3
Percent of Teachers With 1-5 Years Experience
School:
34.6%
District:
30.1%
State:
31.0%
Percent of Teachers With 6-10 Years Experience
School:
10.1%
District:
21.1%
State:
20.3%
Percent of Teachers With 11-20 Years Experience
School:
19.6%
District:
21.6%
State:
24.4%
Percent of Teachers With Greater Than 20 Years Experience
School:
31.8%
District:
21.1%
State:
18.3%
Source: TX Department of Education, Source: NCES 2009-2010
School Ratings and Reviews
Be The First To Review Furr High School!
School Map and Similar Schools Nearby
Click to Activate Map of Nearby School Campuses
Private
Public
This School
Similar Schools Nearby
| Galena Park High School 9-12 | 1,857 Students | 2.9 miles away | Not Yet Rated | |
| Galena Park Middle School 6-9 | 1,002 Students | 3.2 miles away | Not Yet Rated | |
| Wheatley High School 9-12 | 1,086 Students | 4.4 miles away | Not Yet Rated | |
| North Shore Middle School 7-10 | 1,304 Students | 4.9 miles away | Not Yet Rated | |
| Kashmere High School 9-12 | 593 Students | 4.9 miles away |  5 out of 5 | |
| North Shore High School 9-12 | 4,469 Students | 5.0 miles away | Not Yet Rated | |
| Milby High School 9-12 | 2,187 Students | 5.0 miles away | Not Yet Rated | |
| Pasadena High School 9-12 | 2,369 Students | 5.4 miles away | Not Yet Rated | |
| Barbara Jordan High School 9-12 | 1,155 Students | 5.5 miles away | Not Yet Rated | |
| Austin High School 9-12 | 1,944 Students | 6.0 miles away | Not Yet Rated | |
Compare This School To Nearby Schools ->
School Community Forum

Join a discussion about Furr High School and talk to others in the community including students, parents, teachers, and administrators.
Popular Discussion Topics
- Admissions and Registration Questions (e.g. Dress Code and Discipline Policy)
- School Calendar and Upcoming Events (e.g. Graduation)
- After School Programs, Extracurricular Activities, and Athletics (e.g. Football)
- News and Announcements (e.g. Yearbook and Class Supply List Details)
- Graduate and Alumni Events (e.g. Organizing Class Reunions)
Navigation
Can't Find What You Are Looking For?
Nearby Cities
Sponsored Links
K-12 Articles

Internet Safety for Kids of All Ages
Kids are being introduced to the Internet at a very young age. Research for homework and school...
Kids are being introduced to the Internet at a very young age. Research for homework and school...

Feeling Good in Your Own Skin
Body image is a very touchy issue with today’s kids. Since the 1950s, when Barbie was first...
Body image is a very touchy issue with today’s kids. Since the 1950s, when Barbie was first...

Cut the Credit and Save You Some Money
Today’s society glorifies a get-it-now mentality. Children learn this early. You probably noticed...
Today’s society glorifies a get-it-now mentality. Children learn this early. You probably noticed...