Pride Alternative School
Rating
Not Available
Not Available

No Reviews Yet
Find Old Friends From Pride Alternative School
Use the form below to search for alumni from Pride Alternative School.
School Description
School Summary and Highlights
- Enrolls 86 high school students from grades 9-12
- 2010 Overall School AYP Met Status: Yes
Additional Contact Information
- Mailing Address: P O Box 328, Huntington, TX 75949
- Principal or Admin: Mr Harold V Hill
- Fax: (936) 876-4352
- Website: www.huntingtonisd.com
School Operational Details
- Alternative School
- Title I EligibleAll students of this school are eligible for participation in authorized programs.
School District Details
- Huntington Independent School District (ISD)
- Per-Pupil Spending: $7,392
- Graduation Rate: 84.8%
- Students Per Teacher: 13.9
- Enrolled Students: 1,750
Faculty Details and Student Enrollment
Students and Faculty
- Total Students Enrolled: 86
- Total Full Time "Equivalent" Teachers: 3.0
- Average Student-To-Teacher Ratio: 28.5
Students Gender Breakdown
- Males: 41 (47.7%)
- Females: 45 (52.3%)
Free Lunch Student Eligibility Breakdown
- Eligible for Reduced Lunch: 2 (2.3%)
- Eligible for Free Lunch: 50 (58.1%)
- Eligible for Either Reduced or Free Lunch: 52 (60.5%)
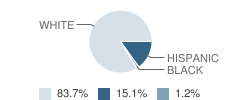
Student Enrollment Distribution by Race / Ethnicity
| Number | Percent | |
|---|---|---|
| American Indian | - | - |
| Black | 1 | 1.2% |
| Asian | - | - |
| Hispanic | 13 | 15.1% |
| White | 72 | 83.7% |
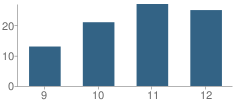
Number of Students Per Grade
| Number | Percent | |
|---|---|---|
| 9th Grade | 13 | 15.1% |
| 10th Grade | 21 | 24.4% |
| 11th Grade | 27 | 31.4% |
| 12th Grade | 25 | 29.1% |
Breakdown of College Ready Graduates (2009)
Percent Ready For College in Reading
School:
44.0%
District:
55.0%
State:
62.0%
Percent Ready For College in Math
School:
31.0%
District:
35.0%
State:
60.0%
Graduation & Dropout Rates (2009)
Graduation Rate
School:
51.7%
District:
78.8%
State:
80.6%
Dropout Rate
School:
10.3%
District:
6.4%
State:
9.4%
Faculty Breakdown (2010)
Average Teacher Experience
School:
23.0
District:
12.4
State:
11.3
Percent of Teachers With 1-5 Years Experience
School:
33.1%
District:
27.0%
State:
31.0%
Percent of Teachers With Greater Than 20 Years Experience
School:
33.8%
District:
24.3%
State:
18.3%
Faculty Salary (2010)
Teacher Average Base Salary
School:
$45,290
District:
$39,522
State:
$48,263
Beginning Teacher Average Base Salary
School:
$32,131
District:
$33,183
State:
$41,165
Teacher With 1-5 Years Experience Average Base Salary
School:
$48,692
State:
$43,527
Teacher With Greater Than 20 Years Experience Average Base Salary
School:
$54,841
State:
$58,427
Source: TX Department of Education, Source: NCES 2009-2010
School Ratings and Reviews
Be The First To Review Pride Alternative School!
School Map and Similar Schools Nearby
Click to Activate Map of Nearby School Campuses
Private
Public
This School
Similar Schools Nearby
| Stubblefield Learn Center School 9-12 | 19 Students | 10.1 miles away | Not Yet Rated | |
| Juvenile Detention Center School 8-11 | 5 Students | 10.5 miles away | Not Yet Rated | - |
| Stubblefield Learn Center School 12 | 1 Students | 11.8 miles away | Not Yet Rated | - |
| Diboll Disciplinary Alternative Education Program School 9-11 | 9 Students | 12.9 miles away |  3 out of 5 | - |
| Martin School of Choice 8-12 | 50 Students | 22.8 miles away | Not Yet Rated | |
Compare This School To Nearby Schools ->
Navigation
Can't Find What You Are Looking For?
Nearby Cities
Sponsored Links
K-12 Articles

Those Pesky Little Transitions
Transitions are rarely easy, yet we have to encounter them every day of our lives. For school-aged...
Transitions are rarely easy, yet we have to encounter them every day of our lives. For school-aged...

Teaching Your Kids About Respect, Values and Violence
These days it seems that every newscast reports at least once incident of violence. As parents, we...
These days it seems that every newscast reports at least once incident of violence. As parents, we...

Information on Cyberbullying
What is Cyberbullying? Cyberbullying is a new form of harassment, emotional abuse,...
What is Cyberbullying? Cyberbullying is a new form of harassment, emotional abuse,...