Hilmar High School

5 out of 5 | 1 Review
Find Old Friends From Hilmar High School
Use the form below to search for alumni from Hilmar High School.
School Description
School Summary and Highlights
- Enrolls 699 high school students from grades 9-12
- Ranks 554th out of 1,197 high schools in CA.
- 2010 Overall School AYP Met Status: Yes
Additional Contact Information
- Mailing Address: 7807 North Lander Ave., Hilmar, CA 95324
School District Details
- Hilmar Unified School District
- Per-Pupil Spending: $8,262
- Graduation Rate: 79.2%
- Dropout Rate: 2.1%
- Students Per Teacher: 19.5
- Enrolled Students: 2,276
Faculty Details and Student Enrollment
Students and Faculty
- Total Students Enrolled: 699
- Total Full Time "Equivalent" Teachers: 33.8
- Average Student-To-Teacher Ratio: 20.7
Students Gender Breakdown
- Males: 369 (52.8%)
- Females: 330 (47.2%)
Free Lunch Student Eligibility Breakdown
- Eligible for Reduced Lunch: 94 (13.4%)
- Eligible for Free Lunch: 227 (32.5%)
- Eligible for Either Reduced or Free Lunch: 321 (45.9%)
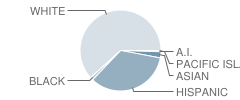
Student Enrollment Distribution by Race / Ethnicity

| Number | Percent | |
|---|---|---|
| American Indian | 3 | 0.4% |
| Black | 8 | 1.1% |
| Asian | 17 | 2.4% |
| Hispanic | 232 | 33.2% |
| White | 419 | 59.9% |
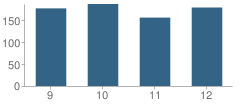
Number of Students Per Grade

| Number | Percent | |
|---|---|---|
| 9th Grade | 177 | 25.3% |
| 10th Grade | 187 | 26.8% |
| 11th Grade | 156 | 22.3% |
| 12th Grade | 179 | 25.6% |
Graduates Information (2010)
Graduation Rate
School:
95.4%
District:
91.2%
State:
78.6%
Teacher Education Background (2009)
Percent With Master's Degree
School:
18.9%
District:
33.3%
Percent With Bachelor's Degree: 5.4%
Teacher Credentials & Experience (2009)
Percent of Teachers With Credentials: 100.0%
Number of Certificated Staff: 37.0
Average Number of Years of Teacher Experience: 16.9
Average Age
School:
43.7
District:
46.0
Source: CA Department of Education, Source: NCES 2009-2010
Sponsored Links
Test Scores and Performance Information
Overall School Rating
How is this determined?
The overall school rating shows that Hilmar High School performed on average about the same as other schools across the state on CST state exams in the following subjects:
- CST Algebra I
- CST Algebra II
- CST Biology
- CST Chemistry
- CST Earth Science
- CST English-Language Arts
- CST Geometry
- CST Physics
- CST Science
- CST Summative High School Math
- CST U.S. History
- CST World History
AYP Results (2010)
Overall AYP Met: Yes
ELA AYP Met: Yes
Math AYP Met: Yes
ACT Exam Results (2009)
Percent of Students Taking ACT Exam: 14.0%
Average Combined Score: 19.8
Percent Scoring At or Above 21: 48.0%
SAT Exam Results (2009)
Percent of Students Taking SAT Exam: 27.9%
Average Combined Score: 1,473.4
Critical Reading Average: 487.4
Math Average: 504.0
Writing Average: 482.0
Percent Scoring At or Above 1500: 48.0%
CST - Test Proficiency by Grade and Subject
Grade 9 - % of students at or above proficiency
| School | District | State | |
|---|---|---|---|
| CST Algebra I Test | |||
| 2010 | 22.0% | 22.0% | 22.0% |
| 2009 | 48.0% | 48.0% | 21.0% |
| 2008 | 17.0% | 17.0% | 18.0% |
| CST Biology Test | |||
| 2010 | 80.0% | 80.0% | 55.0% |
| 2009 | 74.0% | 74.0% | 51.0% |
| 2008 | 30.0% | 30.0% | 52.0% |
| CST Earth Science Test | |||
| 2010 | 45.0% | 45.0% | 35.0% |
| 2009 | 52.0% | 52.0% | 29.0% |
| 2008 | 17.0% | 15.0% | 31.0% |
| CST English-Language Arts Test | |||
| 2010 | 61.0% | 61.0% | 54.0% |
| 2009 | 54.0% | 54.0% | 50.0% |
| 2008 | 50.0% | 49.0% | 49.0% |
| CST Geometry Test | |||
| 2010 | 36.0% | 36.0% | 46.0% |
| 2009 | 35.0% | 35.0% | 47.0% |
| 2008 | 25.0% | 25.0% | 43.0% |
Grade 10 - % of students at or above proficiency
| School | District | State | |
|---|---|---|---|
| CST Algebra II Test | |||
| 2010 | 23.0% | 23.0% | 40.0% |
| 2009 | 14.0% | 14.0% | 37.0% |
| 2008 | 18.0% | 18.0% | 36.0% |
| CST Biology Test | |||
| 2010 | 56.0% | 55.0% | 38.0% |
| 2009 | 31.0% | 30.0% | 34.0% |
| 2008 | 26.0% | 26.0% | 35.0% |
| CST Chemistry Test | |||
| 2010 | 20.0% | 20.0% | 47.0% |
| 2009 | 37.0% | 37.0% | 44.0% |
| 2008 | 23.0% | 23.0% | 41.0% |
| CST English-Language Arts Test | |||
| 2010 | 48.0% | 46.0% | 45.0% |
| 2009 | 34.0% | 33.0% | 44.0% |
| 2008 | 41.0% | 40.0% | 41.0% |
| CST Geometry Test | |||
| 2010 | 4.0% | 4.0% | 14.0% |
| 2009 | 14.0% | 14.0% | 14.0% |
| 2008 | 3.0% | 3.0% | 12.0% |
| CST Science Test | |||
| 2010 | 64.0% | 62.0% | 46.0% |
| 2009 | 51.0% | 49.0% | 44.0% |
| 2008 | 41.0% | 39.0% | 40.0% |
| CST World History Test | |||
| 2010 | 45.0% | 44.0% | 42.0% |
| 2009 | 34.0% | 34.0% | 38.0% |
| 2008 | 26.0% | 26.0% | 33.0% |
| CST Algebra I Test | |||
| 2009 | 17.0% | 17.0% | 11.0% |
| 2008 | 11.0% | 11.0% | 9.0% |
| CST Earth Science Test | |||
| 2009 | 44.0% | 48.0% | 23.0% |
Grade 11 - % of students at or above proficiency
| School | District | State | |
|---|---|---|---|
| CST Algebra II Test | |||
| 2010 | 6.0% | 6.0% | 14.0% |
| 2009 | 3.0% | 3.0% | 12.0% |
| 2008 | 5.0% | 5.0% | 11.0% |
| CST Biology Test | |||
| 2010 | 62.0% | 55.0% | 46.0% |
| 2009 | 77.0% | 72.0% | 41.0% |
| 2008 | 53.0% | 53.0% | 39.0% |
| CST Chemistry Test | |||
| 2010 | 18.0% | 18.0% | 30.0% |
| 2009 | 10.0% | 10.0% | 27.0% |
| 2008 | 29.0% | 29.0% | 25.0% |
| CST English-Language Arts Test | |||
| 2010 | 42.0% | 38.0% | 42.0% |
| 2009 | 39.0% | 36.0% | 40.0% |
| 2008 | 38.0% | 35.0% | 37.0% |
| CST Geometry Test | |||
| 2010 | 4.0% | 4.0% | 6.0% |
| 2009 | 10.0% | 10.0% | 7.0% |
| 2008 | 5.0% | 5.0% | 6.0% |
| CST Summative High School Math Test | |||
| 2010 | 39.0% | 39.0% | 50.0% |
| 2009 | 25.0% | 25.0% | 47.0% |
| 2008 | 34.0% | 34.0% | 43.0% |
| CST U.S. History Test | |||
| 2010 | 46.0% | 40.0% | 45.0% |
| 2009 | 43.0% | 40.0% | 44.0% |
| 2008 | 27.0% | 25.0% | 38.0% |
| CST Physics Test | |||
| 2009 | 27.0% | 27.0% | 50.0% |
| CST Algebra I Test | |||
| 2008 | 2.0% | 1.0% | 5.0% |
End of Course - % of students at or above proficiency
| School | District | State | |
|---|---|---|---|
| CST Algebra I Test | |||
| 2010 | 20.0% | 25.0% | 31.0% |
| 2009 | 41.0% | 36.0% | 28.0% |
| 2008 | 11.0% | 21.0% | 25.0% |
| CST Algebra II Test | |||
| 2010 | 17.0% | 17.0% | 31.0% |
| 2009 | 11.0% | 11.0% | 28.0% |
| 2008 | 13.0% | 13.0% | 27.0% |
| CST Biology Test | |||
| 2010 | 61.0% | 59.0% | 46.0% |
| 2009 | 59.0% | 56.0% | 42.0% |
| 2008 | 34.0% | 34.0% | 42.0% |
| CST Chemistry Test | |||
| 2010 | 19.0% | 19.0% | 38.0% |
| 2009 | 27.0% | 27.0% | 36.0% |
| 2008 | 26.0% | 26.0% | 32.0% |
| CST Earth Science Test | |||
| 2010 | 43.0% | 43.0% | 33.0% |
| 2009 | 51.0% | 51.0% | 28.0% |
| 2008 | 26.0% | 23.0% | 28.0% |
| CST Geometry Test | |||
| 2010 | 13.0% | 13.0% | 27.0% |
| 2009 | 22.0% | 22.0% | 26.0% |
| 2008 | 12.0% | 12.0% | 24.0% |
| CST Summative High School Math Test | |||
| 2010 | 39.0% | 39.0% | 54.0% |
| 2009 | 25.0% | 25.0% | 50.0% |
| 2008 | 37.0% | 37.0% | 47.0% |
| CST World History Test | |||
| 2010 | 45.0% | 42.0% | 41.0% |
| 2009 | 34.0% | 33.0% | 38.0% |
| 2008 | 26.0% | 26.0% | 33.0% |
| CST Physics Test | |||
| 2009 | 27.0% | 27.0% | 46.0% |
| 2008 | 54.0% | 54.0% | 43.0% |
Source: CA Department of Education 2009-2010
School Map and Similar Schools Nearby
Click to Activate Map of Nearby School Campuses
Private
Public
This School
Similar Schools Nearby
| Delhi High School 9-12 | 682 Students | 3.5 miles away | Not Yet Rated | |
| Turlock High School 9-12 | 2,250 Students | 6.8 miles away | ![]() 5 out of 5 | |
| Livingston High School 9-12 | 1,198 Students | 7.2 miles away | ![]() 5 out of 5 | |
| Turlock Junior High School 7-8 | 1,315 Students | 8.7 miles away | Not Yet Rated | |
| Denair High School 9-12 | 355 Students | 8.7 miles away | Not Yet Rated | |
| John H. Pitman High School 9-12 | 2,207 Students | 8.8 miles away | Not Yet Rated | |
| Orestimba High School 9-12 | 738 Students | 11.4 miles away | Not Yet Rated | |
| Yolo Junior High School 6-8 | 622 Students | 11.9 miles away | ![]() 4 out of 5 | |
| Gustine High School 9-12 | 528 Students | 12.9 miles away | ![]() 5 out of 5 | |
| Atwater High School 9-12 | 1,916 Students | 13.1 miles away | ![]() 4.5 out of 5 | |
Compare This School To Nearby Schools ->
School Community Forum

Join a discussion about Hilmar High School and talk to others in the community including students, parents, teachers, and administrators.
Popular Discussion Topics
- Admissions and Registration Questions (e.g. Dress Code and Discipline Policy)
- School Calendar and Upcoming Events (e.g. Graduation)
- After School Programs, Extracurricular Activities, and Athletics (e.g. Football)
- News and Announcements (e.g. Yearbook and Class Supply List Details)
- Graduate and Alumni Events (e.g. Organizing Class Reunions)
Navigation
Can't Find What You Are Looking For?
Rankings
Nearby Cities
Sponsored Links
K-12 Articles
Cutting Class
Depression is a very real problem for today's youth. When your spirit doesn't feel good, a lot of...
When Bad Report Cards Happen to Good Kids
It's mid-term season once again, and semester (or quarter or trimester) grades will be coming out...
National Memories
Few events are seared into our memory, and bring the country together-not as Democrat and...


(5 / 5) 

