Iola High School
Rating
Not Available
Not Available

3.5 out of 5 | 2 Reviews
Find Old Friends From Iola High School
Use the form below to search for alumni from Iola High School.
School Description
School Summary and Highlights
- Enrolls 241 middle and high school students from grades 7-12
- Ranks 434th out of 1,325 high schools in TX.
- 2010 Overall School AYP Met Status: Yes
Additional Contact Information
- Mailing Address: P O Box 159, Iola, TX 77861
- Principal or Admin: Mr Jeff Dyer
- Fax: (936) 394-4700
- Website: www.iolaisd.net
School Operational Details
- Title I EligibleAll students of this school are eligible for participation in authorized programs.
School District Details
- Iola Independent School District (ISD)
- Per-Pupil Spending: $9,114
- Graduation Rate: 97.5%
- Students Per Teacher: 12.0
- Enrolled Students: 509
Faculty Details and Student Enrollment
Students and Faculty
- Total Students Enrolled: 241
- Total Full Time "Equivalent" Teachers: 21.2
- Average Student-To-Teacher Ratio: 11.4
Students Gender Breakdown
- Males: 111 (46.1%)
- Females: 130 (53.9%)
Free Lunch Student Eligibility Breakdown
- Eligible for Reduced Lunch: 24 (10.0%)
- Eligible for Free Lunch: 86 (35.7%)
- Eligible for Either Reduced or Free Lunch: 110 (45.6%)
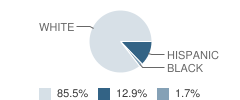
Student Enrollment Distribution by Race / Ethnicity
| Number | Percent | |
|---|---|---|
| American Indian | - | - |
| Black | 4 | 1.7% |
| Asian | - | - |
| Hispanic | 31 | 12.9% |
| White | 206 | 85.5% |
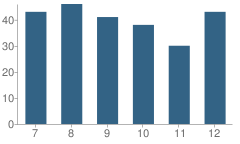
Number of Students Per Grade
| Number | Percent | |
|---|---|---|
| 7th Grade | 43 | 17.8% |
| 8th Grade | 46 | 19.1% |
| 9th Grade | 41 | 17.0% |
| 10th Grade | 38 | 15.8% |
| 11th Grade | 30 | 12.4% |
| 12th Grade | 43 | 17.8% |
Breakdown of College Ready Graduates (2009)
Percent Ready For College in Reading
School:
48.0%
District:
48.0%
State:
62.0%
Percent Ready For College in Math
School:
79.0%
District:
43.0%
State:
60.0%
Graduation & Dropout Rates (2009)
Graduation Rate
School:
97.3%
District:
97.3%
State:
80.6%
Dropout Rate
School:
2.7%
District:
2.7%
State:
9.4%
Faculty Salary (2010)
School Administration Average Base Salary
School:
$71,884
District:
$71,884
State:
$70,209
Teacher Average Base Salary
School:
$45,036
District:
$45,060
State:
$48,263
Beginning Teacher Average Base Salary
School:
$36,777
District:
$37,541
State:
$41,165
Teacher With 1-5 Years Experience Average Base Salary
School:
$39,087
State:
$43,527
Teacher With 6-10 Years Experience Average Base Salary
School:
$50,635
State:
$46,149
Teacher With 11-20 Years Experience Average Base Salary
School:
$47,117
State:
$50,153
Teacher With Greater Than 20 Years Experience Average Base Salary
School:
$51,908
State:
$58,427
Faculty Breakdown (2010)
Average Teacher Experience
School:
11.2
District:
12.5
State:
11.3
Percent of Teachers With 1-5 Years Experience
School:
23.5%
District:
21.2%
State:
31.0%
Percent of Teachers With 6-10 Years Experience
School:
4.7%
District:
7.1%
State:
20.3%
Percent of Teachers With 11-20 Years Experience
School:
37.2%
District:
40.0%
State:
24.4%
Percent of Teachers With Greater Than 20 Years Experience
School:
21.3%
District:
22.4%
State:
18.3%
Source: TX Department of Education, Source: NCES 2009-2010
School Ratings and Reviews
Overall Rating: 3.5

3.5 out of 5 | 2 Reviews
The Overall Rating is the school's average rating from parents, students, school faculty and staff. The highest rating is five apples and the lowest is one apple.
Share Your Review About This School
2 reviews for Iola High School
- Reviewed by Parent/Guardian on May 27, 2010
- Rating:
 (5 / 5) Flag as inappropriate
 - Tell me about Iola schools and if the kids go on to univeristies?
- Reviewed by Parent/Guardian on January 11, 2010
- Rating:
 (2 / 5) Flag as inappropriate
 - yhrthsrth
School Map and Similar Schools Nearby
Click to Activate Map of Nearby School Campuses
Private
Public
This School
Similar Schools Nearby
| North Zulch High School 7-12 | 142 Students | 10.5 miles away | Not Yet Rated | |
| Madisonville Junior High School 6-8 | 499 Students | 15.8 miles away | Not Yet Rated | |
| James Earl Rudder High School 9-11 | 937 Students | 16.9 miles away | Not Yet Rated | |
| Bryan High School 9-12 | 2,481 Students | 17.4 miles away | Not Yet Rated | |
| Normangee High School 9-12 | 169 Students | 18.2 miles away | Not Yet Rated | |
| A & M Cons High School 9-12 | 2,730 Students | 19.0 miles away | Not Yet Rated | |
| Anderson-Shiro Secondary School 6-12 | 360 Students | 19.8 miles away | Not Yet Rated | |
| Richards High School 7-12 | 58 Students | 20.9 miles away |  3.5 out of 5 | |
| Navasota Junior High School 6-8 | 578 Students | 25.4 miles away | Not Yet Rated | |
| Navasota High School 9-12 | 810 Students | 25.4 miles away | Not Yet Rated | |
Compare This School To Nearby Schools ->
School Community Forum

Join a discussion about Iola High School and talk to others in the community including students, parents, teachers, and administrators.
Popular Discussion Topics
- Admissions and Registration Questions (e.g. Dress Code and Discipline Policy)
- School Calendar and Upcoming Events (e.g. Graduation)
- After School Programs, Extracurricular Activities, and Athletics (e.g. Football)
- News and Announcements (e.g. Yearbook and Class Supply List Details)
- Graduate and Alumni Events (e.g. Organizing Class Reunions)
Navigation
Can't Find What You Are Looking For?
Nearby Cities
Sponsored Links
K-12 Articles

Teaching Children Respect
Statistics prove that there are many different family types in today’s society. Grandparents or a...
Statistics prove that there are many different family types in today’s society. Grandparents or a...

Making Sense of No Child Left Behind
The No Child Left Behind Act of 2001 has met with mixed results and mixed feelings. Some think it...
The No Child Left Behind Act of 2001 has met with mixed results and mixed feelings. Some think it...

Teacher Tenure: A Double-Edged Sword
Teacher Tenure (the policy making it almost impossible to fire teachers) has noble roots. It was...
Teacher Tenure (the policy making it almost impossible to fire teachers) has noble roots. It was...