Italy High School
Rating
Not Available
Not Available

No Reviews Yet
Find Old Friends From Italy High School
Use the form below to search for alumni from Italy High School.
School Description
School Summary and Highlights
- Enrolls 302 middle and high school students from grades 7-12
- Ranks 986th out of 1,325 high schools in TX.
- 2010 Overall School AYP Met Status: Yes
Additional Contact Information
- Mailing Address: 300 S College, Italy, TX 76651
- Principal or Admin: Mr Don Clingenpeel
- Fax: (972) 483-1500
- Website: www.italyisd.org
School Operational Details
- Title I EligibleAll students of this school are eligible for participation in authorized programs.
School District Details
- Italy Independent School District (ISD)
- Per-Pupil Spending: $8,278
- Graduation Rate: 81.6%
- Dropout Rate: 4.1%
- Students Per Teacher: 10.6
- Enrolled Students: 638
Faculty Details and Student Enrollment
Students and Faculty
- Total Students Enrolled: 302
- Total Full Time "Equivalent" Teachers: 28.0
- Average Student-To-Teacher Ratio: 10.8
Students Gender Breakdown
- Males: 164 (54.3%)
- Females: 138 (45.7%)
Free Lunch Student Eligibility Breakdown
- Eligible for Reduced Lunch: 36 (11.9%)
- Eligible for Free Lunch: 125 (41.4%)
- Eligible for Either Reduced or Free Lunch: 161 (53.3%)
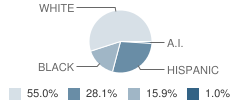
Student Enrollment Distribution by Race / Ethnicity
| Number | Percent | |
|---|---|---|
| American Indian | 3 | 1.0% |
| Black | 48 | 15.9% |
| Asian | - | - |
| Hispanic | 85 | 28.1% |
| White | 166 | 55.0% |
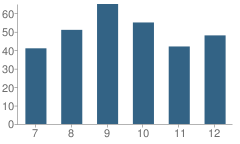
Number of Students Per Grade
| Number | Percent | |
|---|---|---|
| 7th Grade | 41 | 13.6% |
| 8th Grade | 51 | 16.9% |
| 9th Grade | 65 | 21.5% |
| 10th Grade | 55 | 18.2% |
| 11th Grade | 42 | 13.9% |
| 12th Grade | 48 | 15.9% |
Breakdown of College Ready Graduates (2009)
Percent Ready For College in Reading
School:
77.0%
District:
77.0%
State:
62.0%
Percent Ready For College in Math
School:
23.0%
District:
58.0%
State:
60.0%
Graduation & Dropout Rates (2009)
Graduation Rate
School:
85.0%
District:
85.0%
State:
80.6%
Dropout Rate
School:
7.5%
District:
7.5%
State:
9.4%
Faculty Breakdown (2010)
Average Teacher Experience
School:
13.2
District:
11.7
State:
11.3
Percent of Teachers With 1-5 Years Experience
School:
25.0%
District:
33.3%
State:
31.0%
Percent of Teachers With 6-10 Years Experience
School:
10.7%
District:
16.7%
State:
20.3%
Percent of Teachers With 11-20 Years Experience
School:
35.7%
District:
26.7%
State:
24.4%
Percent of Teachers With Greater Than 20 Years Experience
School:
17.9%
District:
16.7%
State:
18.3%
Faculty Salary (2010)
School Administration Average Base Salary
School:
$75,000
District:
$76,397
State:
$70,209
Teacher Average Base Salary
School:
$39,357
District:
$38,807
State:
$48,263
Beginning Teacher Average Base Salary
School:
$6,667
District:
$12,768
State:
$41,165
Teacher With 1-5 Years Experience Average Base Salary
School:
$34,495
State:
$43,527
Teacher With 6-10 Years Experience Average Base Salary
School:
$40,164
State:
$46,149
Teacher With 11-20 Years Experience Average Base Salary
School:
$47,726
State:
$50,153
Teacher With Greater Than 20 Years Experience Average Base Salary
School:
$48,553
State:
$58,427
Source: TX Department of Education, Source: NCES 2009-2010
School Ratings and Reviews
Be The First To Review Italy High School!
School Map and Similar Schools Nearby
Click to Activate Map of Nearby School Campuses
Private
Public
This School
Similar Schools Nearby
| Avalon School PK-12 | 332 Students | 5.4 miles away | Not Yet Rated | |
| Milford School PK-12 | 254 Students | 5.9 miles away | Not Yet Rated | |
| Frost High School 6-12 | 178 Students | 7.9 miles away | Not Yet Rated | |
| Blooming Grove Junior High School 6-8 | 211 Students | 11.7 miles away | Not Yet Rated | |
| Maypearl Junior High School 7-8 | 187 Students | 12.1 miles away | Not Yet Rated | |
| Maypearl High School 9-12 | 319 Students | 12.1 miles away |  1 out of 5 | |
| Itasca High School 9-12 | 186 Students | 15.5 miles away | 1 out of 5 | |
| Itasca Junior High School 5-8 | 227 Students | 15.6 miles away | Not Yet Rated | |
| Bynum School PK-12 | 233 Students | 16.4 miles away | Not Yet Rated | |
| Grandview High School 9-12 | 346 Students | 18.2 miles away | Not Yet Rated | |
Compare This School To Nearby Schools ->
School Community Forum

Join a discussion about Italy High School and talk to others in the community including students, parents, teachers, and administrators.
Popular Discussion Topics
- Admissions and Registration Questions (e.g. Dress Code and Discipline Policy)
- School Calendar and Upcoming Events (e.g. Graduation)
- After School Programs, Extracurricular Activities, and Athletics (e.g. Football)
- News and Announcements (e.g. Yearbook and Class Supply List Details)
- Graduate and Alumni Events (e.g. Organizing Class Reunions)
Navigation
Can't Find What You Are Looking For?
Nearby Cities
Sponsored Links
K-12 Articles

Hurt: A Book Report
My last book report was over 15 years ago, and I'm a bit rusty, but here goes (Don't forget: book...
My last book report was over 15 years ago, and I'm a bit rusty, but here goes (Don't forget: book...

Bullies... What Are They Good For?
Bullies have been around since the beginning of time. We had to deal with bullies, and our parents...
Bullies have been around since the beginning of time. We had to deal with bullies, and our parents...

Democracy in Action
There is still over a year until the general election, but the election cycle has been in full...
There is still over a year until the general election, but the election cycle has been in full...