Holtville High School
Rating
Not Available
Not Available

5 out of 5 | 1 Review
Find Old Friends From Holtville High School
Use the form below to search for alumni from Holtville High School.
School Description
School Summary and Highlights
- Enrolls 574 high school students from grades 9-12
- Ranks 719th out of 1,197 high schools in CA.
- 2010 Overall School AYP Met Status: No
Additional Contact Information
- Mailing Address: 755 Olive Ave., Holtville, CA 92250
School Operational Details
- Title I EligibleAll students of this school are eligible for participation in authorized programs.
School District Details
- Holtville Unified School District
- Per-Pupil Spending: $9,072
- Graduation Rate: 91.5%
- Dropout Rate: 0.8%
- Students Per Teacher: 19.8
- Enrolled Students: 1,712
Faculty Details and Student Enrollment
Students and Faculty
- Total Students Enrolled: 574
- Total Full Time "Equivalent" Teachers: 28.5
- Average Student-To-Teacher Ratio: 20.1
Students Gender Breakdown
- Males: 294 (51.2%)
- Females: 280 (48.8%)
Free Lunch Student Eligibility Breakdown
- Eligible for Reduced Lunch: 40 (7.0%)
- Eligible for Free Lunch: 350 (61.0%)
- Eligible for Either Reduced or Free Lunch: 390 (67.9%)
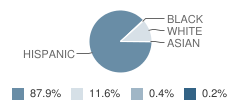
Student Enrollment Distribution by Race / Ethnicity
| Number | Percent | |
|---|---|---|
| American Indian | - | - |
| Black | 2 | 0.3% |
| Asian | 1 | 0.2% |
| Hispanic | 500 | 87.1% |
| White | 66 | 11.5% |
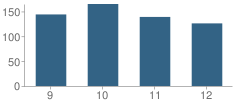
Number of Students Per Grade
| Number | Percent | |
|---|---|---|
| 9th Grade | 144 | 25.1% |
| 10th Grade | 165 | 28.7% |
| 11th Grade | 139 | 24.2% |
| 12th Grade | 126 | 22.0% |
Graduates Information (2010)
Graduation Rate
School:
94.6%
District:
93.4%
State:
78.6%
Teacher Education Background (2009)
Percent With Ph.D.: 5.9%
Percent With Master's Degree
School:
5.9%
District:
14.3%
Percent With Bachelor's Degree: 23.5%
Teacher Credentials & Experience (2009)
Percent of Teachers With Credentials: 64.3%
Number of Certificated Staff: 34.0
Average Number of Years of Teacher Experience: 9.3
Average Age
School:
41.8
District:
47.4
Source: CA Department of Education, Source: NCES 2009-2010
School Ratings and Reviews
Overall Rating: 5

5 out of 5 | 1 Review
The Overall Rating is the school's average rating from parents, students, school faculty and staff. The highest rating is five apples and the lowest is one apple.
Share Your Review About This School
1 review for Holtville High School
- Reviewed by Student on March 11, 2009
- Rating:
 (5 / 5) Flag as inappropriate
 - It is a great school! The education is absolutey astounding and so is the campus itself. The school is small but inviting to visitors and students!
School Map and Similar Schools Nearby
Click to Activate Map of Nearby School Campuses
Private
Public
This School
Similar Schools Nearby
| Holtville Junior High School 6-8 | 312 Students | 0.9 miles away | Not Yet Rated | |
| Central High School 9-12 | 1,765 Students | 10.5 miles away |  5 out of 5 | |
| Wilson Junior High School 7-8 | 766 Students | 10.7 miles away | Not Yet Rated | |
| Enrique Camarena Jr. High School 7-9 | 681 Students | 11.2 miles away | Not Yet Rated | |
| Imperial High School 9-12 | 924 Students | 11.3 miles away | Not Yet Rated | |
| Calexico High School 10-12 | 2,136 Students | 11.3 miles away |  2 out of 5 | |
| Southwest High School 9-12 | 2,157 Students | 11.5 miles away | 5 out of 5 | |
| De Anza Junior High School 7-9 | 880 Students | 11.6 miles away | Not Yet Rated | |
| William Moreno Junior High School 7-9 | 691 Students | 12.2 miles away | Not Yet Rated | |
| Barbara Worth Junior High School 7-8 | 790 Students | 14.4 miles away | 5 out of 5 | |
Compare This School To Nearby Schools ->
School Community Forum

Join a discussion about Holtville High School and talk to others in the community including students, parents, teachers, and administrators.
Popular Discussion Topics
- Admissions and Registration Questions (e.g. Dress Code and Discipline Policy)
- School Calendar and Upcoming Events (e.g. Graduation)
- After School Programs, Extracurricular Activities, and Athletics (e.g. Football)
- News and Announcements (e.g. Yearbook and Class Supply List Details)
- Graduate and Alumni Events (e.g. Organizing Class Reunions)
Navigation
Can't Find What You Are Looking For?
Rankings
Nearby Cities
Sponsored Links
K-12 Articles

School's out for Recess
Recess used to be the best part of school; that and lunch. But today, a shocking two-thirds of...
Recess used to be the best part of school; that and lunch. But today, a shocking two-thirds of...

Bullycide: What is It and How Can It Be Prevented?
Disclaimer: This article expresses my opinion that has been formed by personal experience and...
Disclaimer: This article expresses my opinion that has been formed by personal experience and...

Internet Safety for Kids of All Ages
Kids are being introduced to the Internet at a very young age. Research for homework and school...
Kids are being introduced to the Internet at a very young age. Research for homework and school...