Richard Bard Elementary School
622 East Pleasant Valley Rd, Port Hueneme, CA 93041 | (805) 488-3583
- Grades: KG-6
- Student Enrollment: 670
Rating
Not Available
Not Available

5 out of 5 | 1 Review
Find Old Friends From Richard Bard Elementary School
Use the form below to search for alumni from Richard Bard Elementary School.
School Description
School Summary and Highlights
- Enrolls 670 elementary school students from grades KG-6
- Ranks 4383rd out of 5,423 elementary schools in CA.
- 2010 Overall School AYP Met Status: No
Additional Contact Information
- Mailing Address: 622 East Pleasant Valley Rd., Port Hueneme, CA 93041
School Operational Details
- Title I EligibleAll students of this school are eligible for participation in authorized programs.
School District Details
- Hueneme Elementary School District
- Per-Pupil Spending: $8,706
- Students Per Teacher: 23.2
- Enrolled Students: 8,067
Faculty Details and Student Enrollment
Students and Faculty
- Total Students Enrolled: 670
- Total Full Time "Equivalent" Teachers: 30.0
- Average Student-To-Teacher Ratio: 22.3
Students Gender Breakdown
- Males: 325 (48.5%)
- Females: 345 (51.5%)
Free Lunch Student Eligibility Breakdown
- Eligible for Reduced Lunch: 89 (13.3%)
- Eligible for Free Lunch: 313 (46.7%)
- Eligible for Either Reduced or Free Lunch: 402 (60.0%)
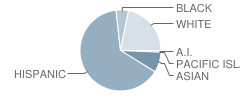
Student Enrollment Distribution by Race / Ethnicity
| Number | Percent | |
|---|---|---|
| American Indian | 4 | 0.6% |
| Black | 33 | 4.9% |
| Asian | 54 | 8.1% |
| Hispanic | 425 | 63.4% |
| White | 144 | 21.5% |
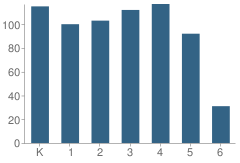
Number of Students Per Grade
| Number | Percent | |
|---|---|---|
| Kindergarten | 115 | 17.2% |
| 1st Grade | 100 | 14.9% |
| 2nd Grade | 103 | 15.4% |
| 3rd Grade | 112 | 16.7% |
| 4th Grade | 117 | 17.5% |
| 5th Grade | 92 | 13.7% |
| 6th Grade | 31 | 4.6% |
Teacher Credentials & Experience (2009)
Percent of Teachers With Credentials: 100.0%
Number of Certificated Staff: 34.0
Average Number of Years of Teacher Experience: 15.9
Average Age
School:
42.6
District:
47.9
Source: CA Department of Education, Source: NCES 2009-2010
School Ratings and Reviews
Overall Rating: 5

5 out of 5 | 1 Review
The Overall Rating is the school's average rating from parents, students, school faculty and staff. The highest rating is five apples and the lowest is one apple.
Share Your Review About This School
1 review for Richard Bard Elementary School
- Reviewed by Parent/Guardian on September 13, 2008
- Rating:
 (5 / 5) Flag as inappropriate
 - GREAT SCHOOL
School Map and Similar Schools Nearby
Click to Activate Map of Nearby School Campuses
Private
Public
This School
Similar Schools Nearby
| Art Haycox Elementary School KG-5 | 806 Students | 0.4 miles away | Not Yet Rated | |
| Parkview Elementary School KG-5 | 724 Students | 0.5 miles away | Not Yet Rated | |
| Hueneme Elementary School KG-6 | 532 Students | 0.5 miles away | Not Yet Rated | |
| Julien Hathaway Elementary School KG-6 | 596 Students | 0.9 miles away | Not Yet Rated | |
| Sunkist Elementary School KG-6 | 796 Students | 1.1 miles away | Not Yet Rated | |
| Ansgar Larsen Elementary School KG-5 | 766 Students | 1.4 miles away |  5 out of 5 | |
| Fred L. Williams Elementary School KG-6 | 641 Students | 1.6 miles away | Not Yet Rated | |
| Harrington Elementary School KG-6 | 531 Students | 1.8 miles away | Not Yet Rated | |
| Kamala Elementary School KG-6 | 960 Students | 2.0 miles away | Not Yet Rated | |
| Mckinna Elementary School KG-6 | 564 Students | 2.0 miles away | Not Yet Rated | |
Compare This School To Nearby Schools ->
School Community Forum

Join a discussion about Richard Bard Elementary School and talk to others in the community including students, parents, teachers, and administrators.
Popular Discussion Topics
- Admissions and Registration Questions (e.g. Dress Code and Discipline Policy)
- School Calendar and Upcoming Events (e.g. Graduation)
- After School Programs, Extracurricular Activities, and Athletics (e.g. Football)
- News and Announcements (e.g. Yearbook and Class Supply List Details)
- Graduate and Alumni Events (e.g. Organizing Class Reunions)
Navigation
Can't Find What You Are Looking For?
Rankings
Nearby Cities
Sponsored Links
K-12 Articles

School Violence: Can It Be Stopped
It's a fact that violence in schools is prevalent in today's society. We hear of school shootings,...
It's a fact that violence in schools is prevalent in today's society. We hear of school shootings,...

Keep Your Licensed Teen Safe This Summer
Every year hundreds of teenage drivers lose their lives in motor vehicle accidents. Statistics show...
Every year hundreds of teenage drivers lose their lives in motor vehicle accidents. Statistics show...

Making Sense of No Child Left Behind
The No Child Left Behind Act of 2001 has met with mixed results and mixed feelings. Some think it...
The No Child Left Behind Act of 2001 has met with mixed results and mixed feelings. Some think it...