Frank M. Wright Middle School
Rating
Not Available
Not Available

No Reviews Yet
Find Old Friends From Frank M. Wright Middle School
Use the form below to search for alumni from Frank M. Wright Middle School.
School Description
School Summary and Highlights
- Enrolls 885 middle school students from grades 6-8
- Ranks 640th out of 2,050 middle schools in CA.
- 2010 Overall School AYP Met Status: Yes
Additional Contact Information
- Mailing Address: 885 North Imperial Ave., Imperial, CA 92251
School Operational Details
- Title I EligibleAll students of this school are eligible for participation in authorized programs.
School District Details
- Imperial Unified School District
- Per-Pupil Spending: $7,712
- Graduation Rate: 69.5%
- Dropout Rate: 0.5%
- Students Per Teacher: 22.3
- Enrolled Students: 3,600
Faculty Details and Student Enrollment
Students and Faculty
- Total Students Enrolled: 885
- Total Full Time "Equivalent" Teachers: 37.6
- Average Student-To-Teacher Ratio: 23.5
Students Gender Breakdown
- Males: 455 (51.4%)
- Females: 430 (48.6%)
Free Lunch Student Eligibility Breakdown
- Eligible for Reduced Lunch: 81 (9.2%)
- Eligible for Free Lunch: 281 (31.8%)
- Eligible for Either Reduced or Free Lunch: 362 (40.9%)
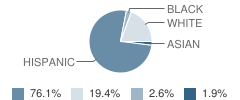
Student Enrollment Distribution by Race / Ethnicity
| Number | Percent | |
|---|---|---|
| American Indian | - | - |
| Black | 23 | 2.6% |
| Asian | 17 | 1.9% |
| Hispanic | 672 | 75.9% |
| White | 171 | 19.3% |
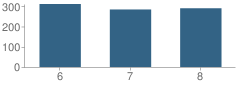
Number of Students Per Grade
| Number | Percent | |
|---|---|---|
| 6th Grade | 311 | 35.1% |
| 7th Grade | 284 | 32.1% |
| 8th Grade | 290 | 32.8% |
Teacher Education Background (2009)
Percent With Ph.D.: 2.6%
Percent With Master's Degree
School:
31.6%
District:
60.0%
Percent With Bachelor's Degree: 13.2%
Teacher Credentials & Experience (2009)
Percent of Teachers With Emergency Credentials: 5.7%
Percent of Teachers With Credentials: 100.0%
Number of Certificated Staff: 38.0
Average Number of Years of Teacher Experience: 10.7
Average Age
School:
36.9
District:
44.0
Source: CA Department of Education, Source: NCES 2009-2010
School Ratings and Reviews
Be The First To Review Frank M. Wright Middle School!
School Map and Similar Schools Nearby
Click to Activate Map of Nearby School Campuses
Private
Public
This School
Similar Schools Nearby
| Kennedy Middle School 6-8 | 601 Students | 3.9 miles away |  5 out of 5 | |
| Sunflower Elementary School KG-6 | 465 Students | 4.4 miles away | Not Yet Rated | |
| Washington School KG-6 | 477 Students | 4.5 miles away | Not Yet Rated | |
| Margaret Hedrick Elementary School KG-6 | 481 Students | 4.7 miles away | Not Yet Rated | |
| Wilson Junior High School 7-8 | 766 Students | 4.7 miles away | Not Yet Rated | |
| Harding Elementary School KG-6 | 484 Students | 5.0 miles away | Not Yet Rated | |
| De Anza School KG-7 | 491 Students | 5.4 miles away | Not Yet Rated | |
| Desert Garden Elementary School KG-6 | 434 Students | 5.5 miles away | Not Yet Rated | |
| Meadows Elementary School KG-8 | 478 Students | 6.9 miles away | Not Yet Rated | |
| Mccabe Elementary School KG-8 | 1,160 Students | 7.2 miles away | Not Yet Rated | |
Compare This School To Nearby Schools ->
School Community Forum

Join a discussion about Frank M. Wright Middle School and talk to others in the community including students, parents, teachers, and administrators.
Popular Discussion Topics
- Admissions and Registration Questions (e.g. Dress Code and Discipline Policy)
- School Calendar and Upcoming Events (e.g. Graduation)
- After School Programs, Extracurricular Activities, and Athletics (e.g. Football)
- News and Announcements (e.g. Yearbook and Class Supply List Details)
- Graduate and Alumni Events (e.g. Organizing Class Reunions)
Navigation
Can't Find What You Are Looking For?
Rankings
Nearby Cities
Sponsored Links
K-12 Articles

Nothing New Under the Sun
"I had to go through the same thing when I went to school." Every parent has uttered this phrase,...
"I had to go through the same thing when I went to school." Every parent has uttered this phrase,...

Transform Your Middle School Slacker into a Scholar
All children need motivation to learn. Have your child's grades decreased since he started middle...
All children need motivation to learn. Have your child's grades decreased since he started middle...

Teaching Kids to Deal with Peer Pressure
Parents usually become very concerned when they hear the term "peer pressure." However, peer...
Parents usually become very concerned when they hear the term "peer pressure." However, peer...