Warren Lane Elementary School
Rating
Not Available
Not Available

No Reviews Yet
Find Old Friends From Warren Lane Elementary School
Use the form below to search for alumni from Warren Lane Elementary School.
School Description
School Summary and Highlights
- Enrolls 589 elementary school students from grades KG-8
- Ranks 1906th out of 2,050 middle schools in CA.
- 2010 Overall School AYP Met Status: No
Additional Contact Information
- Mailing Address: 9330 South Eighth Ave., Inglewood, CA 90305
School Operational Details
- Title I EligibleAll students of this school are eligible for participation in authorized programs.
School District Details
- Inglewood Unified School District
- Per-Pupil Spending: $8,805
- Graduation Rate: 59.6%
- Dropout Rate: 7.9%
- Students Per Teacher: 21.1
- Enrolled Students: 14,438
Faculty Details and Student Enrollment
Students and Faculty
- Total Students Enrolled: 589
- Total Full Time "Equivalent" Teachers: 29.0
- Average Student-To-Teacher Ratio: 20.3
Students Gender Breakdown
- Males: 319 (54.2%)
- Females: 270 (45.8%)
Free Lunch Student Eligibility Breakdown
- Eligible for Reduced Lunch: 48 (8.1%)
- Eligible for Free Lunch: 390 (66.2%)
- Eligible for Either Reduced or Free Lunch: 438 (74.4%)
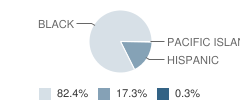
Student Enrollment Distribution by Race / Ethnicity
| Number | Percent | |
|---|---|---|
| American Indian | - | - |
| Black | 482 | 81.8% |
| Asian | - | - |
| Hispanic | 101 | 17.1% |
| White | - | - |
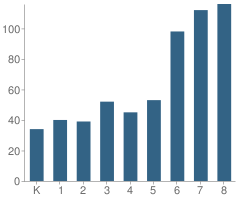
Number of Students Per Grade
| Number | Percent | |
|---|---|---|
| Kindergarten | 34 | 5.8% |
| 1st Grade | 40 | 6.8% |
| 2nd Grade | 39 | 6.6% |
| 3rd Grade | 52 | 8.8% |
| 4th Grade | 45 | 7.6% |
| 5th Grade | 53 | 9.0% |
| 6th Grade | 98 | 16.6% |
| 7th Grade | 112 | 19.0% |
| 8th Grade | 116 | 19.7% |
Teacher Education Background (2009)
Percent With Ph.D.: 3.2%
Percent With Master's Degree: 25.8%
Percent With Bachelor's Degree
School:
12.9%
District:
25.0%
Teacher Credentials & Experience (2009)
Percent of Teachers With Credentials: 84.0%
Number of Certificated Staff: 31.0
Average Number of Years of Teacher Experience: 13.8
Average Age
School:
44.7
District:
32.5
Source: CA Department of Education, Source: NCES 2009-2010
School Ratings and Reviews
Be The First To Review Warren Lane Elementary School!
School Map and Similar Schools Nearby
Click to Activate Map of Nearby School Campuses
Private
Public
This School
Similar Schools Nearby
| Clyde Woodworth Elementary School KG-5 | 582 Students | 0.7 miles away | Not Yet Rated | |
| Manhattan Place Elementary School KG-5 | 479 Students | 0.9 miles away |  5 out of 5 | |
| Daniel Freeman Elementary School KG-6 | 292 Students | 1.1 miles away | 5 out of 5 | |
| Century Park Elementary School KG-5 | 443 Students | 1.2 miles away | 5 out of 5 | |
| La Salle Avenue Elementary School KG-5 | 544 Students | 1.2 miles away | Not Yet Rated | |
| William H. Kelso Elementary School KG-5 | 713 Students | 1.2 miles away | Not Yet Rated | |
| Worthington Elementary School KG-5 | 626 Students | 1.3 miles away | Not Yet Rated | |
| Seventy-Fourth Street Elementary School KG-5 | 568 Students | 1.5 miles away | Not Yet Rated | |
| Dolores Huerta Elementary School KG-5 | 604 Students | 1.6 miles away | Not Yet Rated | |
| Ninety-Fifth Street Elementary School KG-5 | 1,001 Students | 1.7 miles away | Not Yet Rated | |
Compare This School To Nearby Schools ->
School Community Forum

Join a discussion about Warren Lane Elementary School and talk to others in the community including students, parents, teachers, and administrators.
Popular Discussion Topics
- Admissions and Registration Questions (e.g. Dress Code and Discipline Policy)
- School Calendar and Upcoming Events (e.g. Graduation)
- After School Programs, Extracurricular Activities, and Athletics (e.g. Football)
- News and Announcements (e.g. Yearbook and Class Supply List Details)
- Graduate and Alumni Events (e.g. Organizing Class Reunions)
Navigation
Can't Find What You Are Looking For?
Rankings
Nearby Cities
Sponsored Links
K-12 Articles

Keeping Our Kids Safe in the Post 9/11 World
Recently, radio talk show host and CNN personality did a week-long special entitled “The Perfect...
Recently, radio talk show host and CNN personality did a week-long special entitled “The Perfect...

Imho
I was watching Headline News’s news ticker when I read something that made me LOL. The ticker said...
I was watching Headline News’s news ticker when I read something that made me LOL. The ticker said...

Everyone Loves Going to the Doctor and Dentist
Going to the doctor or dentist can be traumatic for children of all ages. Many adults do not...
Going to the doctor or dentist can be traumatic for children of all ages. Many adults do not...