Jacoby Creek Charter School
Rating
Not Available
Not Available

5 out of 5 | 1 Review
Find Old Friends From Jacoby Creek Charter School
Use the form below to search for alumni from Jacoby Creek Charter School.
School Description
School Summary and Highlights
- Enrolls 424 elementary school students from grades KG-8
- Ranks 100th out of 2,050 middle schools in CA.
- 2010 Overall School AYP Met Status: Yes
- National Blue Ribbon Schools Award 2004

Additional Contact Information
- Mailing Address: 1617 Old Arcata Rd., Bayside, CA 95524
School Operational Details
- Title I Eligible
- Charter School
School District Details
- Jacoby Creek Elementary School District
- Per-Pupil Spending: $8,585
- Students Per Teacher: 22.3
- Enrolled Students: 424
Faculty Details and Student Enrollment
Students and Faculty
- Total Students Enrolled: 424
- Total Full Time "Equivalent" Teachers: 19.0
- Average Student-To-Teacher Ratio: 22.3
Students Gender Breakdown
- Males: 195 (46.0%)
- Females: 229 (54.0%)
Free Lunch Student Eligibility Breakdown
- Eligible for Reduced Lunch: 9 (2.1%)
- Eligible for Free Lunch: 46 (10.8%)
- Eligible for Either Reduced or Free Lunch: 55 (13.0%)
Student Enrollment Distribution by Race / Ethnicity
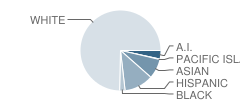
| Number | Percent | |
|---|---|---|
| American Indian | 14 | 3.3% |
| Black | 9 | 2.1% |
| Asian | 32 | 7.5% |
| Hispanic | 47 | 11.1% |
| White | 299 | 70.5% |
Number of Students Per Grade
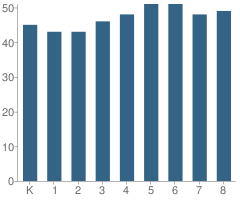
| Number | Percent | |
|---|---|---|
| Kindergarten | 45 | 10.6% |
| 1st Grade | 43 | 10.1% |
| 2nd Grade | 43 | 10.1% |
| 3rd Grade | 46 | 10.8% |
| 4th Grade | 48 | 11.3% |
| 5th Grade | 51 | 12.0% |
| 6th Grade | 51 | 12.0% |
| 7th Grade | 48 | 11.3% |
| 8th Grade | 49 | 11.6% |
Teacher Education Background (2009)
Percent With Master's Degree: 26.9%
Teacher Credentials & Experience (2009)
Percent of Teachers With Credentials: 95.5%
Number of Certificated Staff: 26.0
Average Number of Years of Teacher Experience: 14.9
Average Age: 44.5
Source: CA Department of Education, Source: NCES 2009-2010
School Ratings and Reviews
Overall Rating: 5

5 out of 5 | 1 Review
The Overall Rating is the school's average rating from parents, students, school faculty and staff. The highest rating is five apples and the lowest is one apple.
Share Your Review About This School
1 review for Jacoby Creek Charter School
- Reviewed by Parent/Guardian on August 25, 2009
- Rating:
 (5 / 5) Flag as inappropriate
 - This school rocks. It has met my and my child's needs all the way from first grade.
School Map and Similar Schools Nearby
Click to Activate Map of Nearby School Campuses
Private
Public
This School
Similar Schools Nearby
| Union Street Charter School KG-5 | 97 Students | 1.0 miles away | Not Yet Rated | |
| Fuente Nueva Charter School KG-6 | 90 Students | 2.6 miles away | Not Yet Rated | |
| Trillium Charter School KG-5 | 40 Students | 2.9 miles away | Not Yet Rated | - |
| Pacific View Charter School KG-12 | 188 Students | 5.6 miles away | Not Yet Rated | |
| Alder Grove Charter School KG-12 | 231 Students | 8.1 miles away | Not Yet Rated | |
Compare This School To Nearby Schools ->
School Community Forum

Join a discussion about Jacoby Creek Charter School and talk to others in the community including students, parents, teachers, and administrators.
Popular Discussion Topics
- Admissions and Registration Questions (e.g. Dress Code and Discipline Policy)
- School Calendar and Upcoming Events (e.g. Graduation)
- After School Programs, Extracurricular Activities, and Athletics (e.g. Football)
- News and Announcements (e.g. Yearbook and Class Supply List Details)
- Graduate and Alumni Events (e.g. Organizing Class Reunions)
Navigation
Can't Find What You Are Looking For?
Rankings
Nearby Cities
Sponsored Links
K-12 Articles

Tips for Easing Your Child's Back to School Stress
Do you remember the roller coaster of emotions that you experienced as a child when the day for...
Do you remember the roller coaster of emotions that you experienced as a child when the day for...

Everyone Loves Going to the Doctor and Dentist
Going to the doctor or dentist can be traumatic for children of all ages. Many adults do not...
Going to the doctor or dentist can be traumatic for children of all ages. Many adults do not...

Special Needs Education: Your Child, Your Rights
Many children today have special needs that make it difficult for them to learn. It’s imperative...
Many children today have special needs that make it difficult for them to learn. It’s imperative...