Jefferson School
Rating
Not Available
Not Available

3 out of 5 | 2 Reviews
Find Old Friends From Jefferson School
Use the form below to search for alumni from Jefferson School.
School Description
School Summary and Highlights
- Enrolls 429 elementary school students from grades 5-8
- Ranks 545th out of 2,050 middle schools in CA.
- 2010 Overall School AYP Met Status: No
Additional Contact Information
- Mailing Address: 7500 West Linne Rd., Tracy, CA 95304
School District Details
- Jefferson Elementary School District
- Per-Pupil Spending: $7,287
- Students Per Teacher: 20.9
- Enrolled Students: 2,503
Faculty Details and Student Enrollment
Students and Faculty
- Total Students Enrolled: 429
- Total Full Time "Equivalent" Teachers: 21.0
- Average Student-To-Teacher Ratio: 20.4
Students Gender Breakdown
- Males: 229 (53.4%)
- Females: 200 (46.6%)
Free Lunch Student Eligibility Breakdown
- Eligible for Reduced Lunch: 27 (6.3%)
- Eligible for Free Lunch: 78 (18.2%)
- Eligible for Either Reduced or Free Lunch: 105 (24.5%)
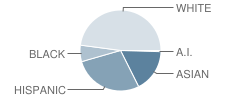
Student Enrollment Distribution by Race / Ethnicity
| Number | Percent | |
|---|---|---|
| American Indian | 2 | 0.5% |
| Black | 28 | 6.5% |
| Asian | 73 | 17.0% |
| Hispanic | 119 | 27.7% |
| White | 204 | 47.6% |
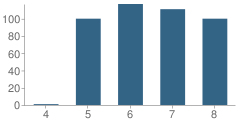
Number of Students Per Grade
| Number | Percent | |
|---|---|---|
| 4th Grade | 1 | 0.2% |
| 5th Grade | 100 | 23.3% |
| 6th Grade | 117 | 27.3% |
| 7th Grade | 111 | 25.9% |
| 8th Grade | 100 | 23.3% |
Teacher Education Background (2009)
Percent With Ph.D.
School:
5.0%
District:
14.3%
Percent With Master's Degree: 15.0%
Percent With Bachelor's Degree: 5.0%
Teacher Credentials & Experience (2009)
Percent of Teachers With Credentials: 100.0%
Number of Certificated Staff: 20.0
Average Number of Years of Teacher Experience: 9.7
Average Age
School:
38.5
District:
40.1
Source: CA Department of Education, Source: NCES 2009-2010
School Ratings and Reviews
Overall Rating: 3

3 out of 5 | 2 Reviews
The Overall Rating is the school's average rating from parents, students, school faculty and staff. The highest rating is five apples and the lowest is one apple.
Share Your Review About This School
2 reviews for Jefferson School
- Reviewed by Student on November 29, 2008
- Rating:
 (1 / 5) Flag as inappropriate
 - this school is great. i have a lot of friends!!! my 5th grade teacher mrs.Gleason is the greatest!!!!
vianey juarez
- Reviewed by Parent/Guardian on January 22, 2008
- Rating:
 (5 / 5) Flag as inappropriate
 - The school principal is great he knows all the children by name.
Michel in the office has all the answers. the school site is always clean. This school is exceptional as well as the staff.
School Map and Similar Schools Nearby
Click to Activate Map of Nearby School Campuses
Private
Public
This School
Similar Schools Nearby
| Gladys Poet-Christian Elementary School KG-8 | 692 Students | 2.2 miles away | Not Yet Rated | |
| Louis A. Bohn Elementary School KG-5 | 505 Students | 2.6 miles away | Not Yet Rated | |
| Wanda Hirsch Elementary School KG-5 | 663 Students | 2.7 miles away |  5 out of 5 | |
| South / West Park Elementary School KG-5 | 935 Students | 2.9 miles away |  2 out of 5 | |
| Central Elementary School KG-5 | 469 Students | 3.6 miles away |  4 out of 5 | |
| Louis J. Villalovoz Elementary School KG-5 | 624 Students | 3.6 miles away | Not Yet Rated | |
| Mckinley Elementary School KG-5 | 418 Students | 4.1 miles away | Not Yet Rated | |
| Banta Elementary School KG-8 | 290 Students | 4.4 miles away | 5 out of 5 | |
| North Elementary School KG-8 | 812 Students | 4.5 miles away | Not Yet Rated | |
| Art Freiler School KG-8 | 1,030 Students | 4.6 miles away |  4.5 out of 5 | |
Compare This School To Nearby Schools ->
School Community Forum

Join a discussion about Jefferson School and talk to others in the community including students, parents, teachers, and administrators.
Popular Discussion Topics
- Admissions and Registration Questions (e.g. Dress Code and Discipline Policy)
- School Calendar and Upcoming Events (e.g. Graduation)
- After School Programs, Extracurricular Activities, and Athletics (e.g. Football)
- News and Announcements (e.g. Yearbook and Class Supply List Details)
- Graduate and Alumni Events (e.g. Organizing Class Reunions)
Navigation
Can't Find What You Are Looking For?
Rankings
Nearby Cities
Sponsored Links
K-12 Articles

School Lunches ... Hot or Cold?
First there were four, now there are six, no one knows how many more there may be in the future....
First there were four, now there are six, no one knows how many more there may be in the future....

Special Needs Education: Your Child, Your Rights
Many children today have special needs that make it difficult for them to learn. It's imperative...
Many children today have special needs that make it difficult for them to learn. It's imperative...

The Pros and Cons of Seat Belts in School Buses
Recently the news has been full of school bus accidents where children have been seriously injured...
Recently the news has been full of school bus accidents where children have been seriously injured...