Tom Hawkins Elementary School
Rating
Not Available
Not Available

4 out of 5 | 2 Reviews
Find Old Friends From Tom Hawkins Elementary School
Use the form below to search for alumni from Tom Hawkins Elementary School.
School Description
School Summary and Highlights
- Enrolls 809 elementary school students from grades KG-8
- Ranks 342nd out of 2,050 middle schools in CA.
- 2010 Overall School AYP Met Status: No
Additional Contact Information
- Mailing Address: 475 Darlene Ln., Tracy, CA 95377
School District Details
- Jefferson Elementary School District
- Per-Pupil Spending: $7,287
- Students Per Teacher: 20.9
- Enrolled Students: 2,503
Faculty Details and Student Enrollment
Students and Faculty
- Total Students Enrolled: 809
- Total Full Time "Equivalent" Teachers: 37.0
- Average Student-To-Teacher Ratio: 21.9
Students Gender Breakdown
- Males: 406 (50.2%)
- Females: 403 (49.8%)
Free Lunch Student Eligibility Breakdown
- Eligible for Reduced Lunch: 50 (6.2%)
- Eligible for Free Lunch: 104 (12.9%)
- Eligible for Either Reduced or Free Lunch: 154 (19.0%)
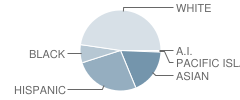
Student Enrollment Distribution by Race / Ethnicity
| Number | Percent | |
|---|---|---|
| American Indian | 3 | 0.4% |
| Black | 59 | 7.3% |
| Asian | 146 | 18.0% |
| Hispanic | 211 | 26.1% |
| White | 382 | 47.2% |
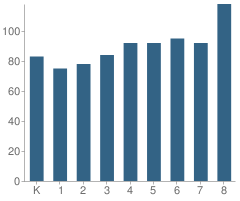
Number of Students Per Grade
| Number | Percent | |
|---|---|---|
| Kindergarten | 83 | 10.3% |
| 1st Grade | 75 | 9.3% |
| 2nd Grade | 78 | 9.6% |
| 3rd Grade | 84 | 10.4% |
| 4th Grade | 92 | 11.4% |
| 5th Grade | 92 | 11.4% |
| 6th Grade | 95 | 11.7% |
| 7th Grade | 92 | 11.4% |
| 8th Grade | 118 | 14.6% |
Teacher Education Background (2009)
Percent With Master's Degree: 4.9%
Percent With Bachelor's Degree: 4.9%
Teacher Credentials & Experience (2009)
Percent of Teachers With Credentials: 92.1%
Number of Certificated Staff: 41.0
Average Number of Years of Teacher Experience: 11.3
Average Age
School:
40.0
District:
40.1
Source: CA Department of Education, Source: NCES 2009-2010
School Ratings and Reviews
Overall Rating: 4

4 out of 5 | 2 Reviews
The Overall Rating is the school's average rating from parents, students, school faculty and staff. The highest rating is five apples and the lowest is one apple.
Share Your Review About This School
2 reviews for Tom Hawkins Elementary School
- Reviewed by Student on July 28, 2009
- Rating:
 (5 / 5) Flag as inappropriate
 - this is a good school.
- Reviewed by Student on May 31, 2009
- Rating:
 (3 / 5) Flag as inappropriate
 - Tom Hawkins School...a great place, surrounded by a friendly/ safe neighbor hood! Their teachers on the other hand, are not as great as the school itself.
School Map and Similar Schools Nearby
Click to Activate Map of Nearby School Campuses
Private
Public
This School
Similar Schools Nearby
| Gladys Poet-Christian Elementary School KG-8 | 692 Students | 1.0 miles away | Not Yet Rated | |
| Wanda Hirsch Elementary School KG-5 | 663 Students | 1.3 miles away |  5 out of 5 | |
| Louis A. Bohn Elementary School KG-5 | 505 Students | 1.6 miles away | Not Yet Rated | |
| South / West Park Elementary School KG-5 | 935 Students | 1.7 miles away |  2 out of 5 | |
| Louis J. Villalovoz Elementary School KG-5 | 624 Students | 2.3 miles away | Not Yet Rated | |
| Central Elementary School KG-5 | 469 Students | 2.6 miles away |  4 out of 5 | |
| Mckinley Elementary School KG-5 | 418 Students | 3.0 miles away | Not Yet Rated | |
| Art Freiler School KG-8 | 1,030 Students | 3.4 miles away |  4.5 out of 5 | |
| North Elementary School KG-8 | 812 Students | 3.6 miles away | Not Yet Rated | |
| Melville S. Jacobson Elementary School KG-5 | 652 Students | 3.9 miles away | Not Yet Rated | |
Compare This School To Nearby Schools ->
School Community Forum

Join a discussion about Tom Hawkins Elementary School and talk to others in the community including students, parents, teachers, and administrators.
Popular Discussion Topics
- Admissions and Registration Questions (e.g. Dress Code and Discipline Policy)
- School Calendar and Upcoming Events (e.g. Graduation)
- After School Programs, Extracurricular Activities, and Athletics (e.g. Football)
- News and Announcements (e.g. Yearbook and Class Supply List Details)
- Graduate and Alumni Events (e.g. Organizing Class Reunions)
Navigation
Can't Find What You Are Looking For?
Rankings
Nearby Cities
Sponsored Links
K-12 Articles

School's out for Recess
Recess used to be the best part of school; that and lunch. But today, a shocking two-thirds of...
Recess used to be the best part of school; that and lunch. But today, a shocking two-thirds of...

Those Pesky Little Transitions
Transitions are rarely easy, yet we have to encounter them every day of our lives. For school-aged...
Transitions are rarely easy, yet we have to encounter them every day of our lives. For school-aged...

Your Child and School Corporal Punishment
Your child comes home at the end of the school day with a huge bruise on his upper arm. When you...
Your child comes home at the end of the school day with a huge bruise on his upper arm. When you...