May High School
Rating
Not Available
Not Available

No Reviews Yet
Find Old Friends From May High School
Use the form below to search for alumni from May High School.
School Description
School Summary and Highlights
- Enrolls 104 middle and high school students from grades 7-12
- Ranks 282nd out of 1,325 high schools in TX.
- 2010 Overall School AYP Met Status: Yes
Additional Contact Information
- Mailing Address: 3400 Cr 411 E, May, TX 76857
- Principal or Admin: Mr Steven L Howard
- Fax: (254) 259-2706
- Website: mayisd.com
School District Details
- May Independent School District (ISD)
- Per-Pupil Spending: $9,870
- Graduation Rate: 60.9%
- Dropout Rate: 4.7%
- Students Per Teacher: 9.0
- Enrolled Students: 253
Faculty Details and Student Enrollment
Students and Faculty
- Total Students Enrolled: 104
- Total Full Time "Equivalent" Teachers: 13.3
- Average Student-To-Teacher Ratio: 7.8
Students Gender Breakdown
- Males: 59 (56.7%)
- Females: 45 (43.3%)
Free Lunch Student Eligibility Breakdown
- Eligible for Reduced Lunch: 16 (15.4%)
- Eligible for Free Lunch: 34 (32.7%)
- Eligible for Either Reduced or Free Lunch: 50 (48.1%)
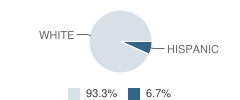
Student Enrollment Distribution by Race / Ethnicity
| Number | Percent | |
|---|---|---|
| American Indian | - | - |
| Black | - | - |
| Asian | - | - |
| Hispanic | 7 | 6.7% |
| White | 97 | 93.3% |
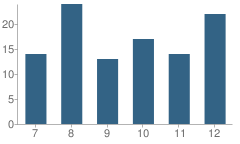
Number of Students Per Grade
| Number | Percent | |
|---|---|---|
| 7th Grade | 14 | 13.5% |
| 8th Grade | 24 | 23.1% |
| 9th Grade | 13 | 12.5% |
| 10th Grade | 17 | 16.3% |
| 11th Grade | 14 | 13.5% |
| 12th Grade | 22 | 21.2% |
Breakdown of College Ready Graduates (2009)
Percent Ready For College in Reading
School:
59.0%
District:
59.0%
State:
62.0%
Percent Ready For College in Math
School:
53.0%
District:
40.0%
State:
60.0%
Graduation & Dropout Rates (2009)
Graduation Rate
School:
90.5%
District:
90.5%
State:
80.6%
Dropout Rate
School:
9.5%
District:
9.5%
State:
9.4%
Faculty Breakdown (2010)
Average Teacher Experience
School:
13.1
District:
12.1
State:
11.3
Percent of Teachers With 1-5 Years Experience
School:
7.5%
District:
17.8%
State:
31.0%
Percent of Teachers With 6-10 Years Experience
School:
16.1%
District:
21.3%
State:
20.3%
Percent of Teachers With 11-20 Years Experience
School:
53.9%
District:
39.5%
State:
24.4%
Percent of Teachers With Greater Than 20 Years Experience
School:
7.5%
District:
10.7%
State:
18.3%
Faculty Salary (2010)
Teacher Average Base Salary
School:
$44,383
District:
$40,822
State:
$48,263
Beginning Teacher Average Base Salary
School:
$35,975
District:
$33,630
State:
$41,165
Teacher With 1-5 Years Experience Average Base Salary
School:
$31,992
State:
$43,527
Teacher With 6-10 Years Experience Average Base Salary
School:
$37,054
State:
$46,149
Teacher With 11-20 Years Experience Average Base Salary
School:
$50,360
State:
$50,153
Teacher With Greater Than 20 Years Experience Average Base Salary
School:
$46,399
State:
$58,427
Source: TX Department of Education, Source: NCES 2009-2010
School Ratings and Reviews
Be The First To Review May High School!
School Map and Similar Schools Nearby
Click to Activate Map of Nearby School Campuses
Private
Public
This School
Similar Schools Nearby
| Rising Star High School 7-12 | 97 Students | 8.9 miles away | Not Yet Rated | |
| Sidney School KG-12 | 122 Students | 11.3 miles away | Not Yet Rated | |
| Blanket High School 9-12 | 67 Students | 13.5 miles away | Not Yet Rated | |
| Early High School PK-KG | 3 Students | 16.2 miles away | Not Yet Rated | - |
| Early High School 9-12 | 354 Students | 16.3 miles away | Not Yet Rated | |
| Cross Plains High School 7-12 | 150 Students | 17.5 miles away | Not Yet Rated | |
| Brownwood High School 9-12 | 829 Students | 20.1 miles away |  3 out of 5 | |
| Comanche High School 9-12 | 329 Students | 20.2 miles away | Not Yet Rated | |
| Jefferies Junior High School 7-8 | 179 Students | 20.3 miles away | Not Yet Rated | |
| Gorman High School 9-12 | 90 Students | 21.6 miles away | Not Yet Rated | |
Compare This School To Nearby Schools ->
School Community Forum

Join a discussion about May High School and talk to others in the community including students, parents, teachers, and administrators.
Popular Discussion Topics
- Admissions and Registration Questions (e.g. Dress Code and Discipline Policy)
- School Calendar and Upcoming Events (e.g. Graduation)
- After School Programs, Extracurricular Activities, and Athletics (e.g. Football)
- News and Announcements (e.g. Yearbook and Class Supply List Details)
- Graduate and Alumni Events (e.g. Organizing Class Reunions)
Navigation
Can't Find What You Are Looking For?
Nearby Cities
Sponsored Links
K-12 Articles

All About Backpacks
Your child riffles through his backpack to find homework assignments, his MP3 player, lunch money...
Your child riffles through his backpack to find homework assignments, his MP3 player, lunch money...

What to Do when Your Student is Held Back
Kids develop at different speeds, and everyone has different skills and abilities. School is easy...
Kids develop at different speeds, and everyone has different skills and abilities. School is easy...

Nothing New Under the Sun
"I had to go through the same thing when I went to school." Every parent has uttered this phrase,...
"I had to go through the same thing when I went to school." Every parent has uttered this phrase,...