Shaw Elementary School
Rating
Not Available
Not Available

1 out of 5 | 1 Review
Find Old Friends From Shaw Elementary School
Use the form below to search for alumni from Shaw Elementary School.
School Description
School Summary and Highlights
- Enrolls 740 elementary school students from grades KG-6
- Ranks 3057th out of 4,319 elementary schools in TX.
- 2010 Overall School AYP Met Status: No
Additional Contact Information
- Principal or Admin: Ms Kim Gregory-Johnson
- Fax: (972) 882-7070
- Website: www.mesquiteisd.org
School Operational Details
- Title I EligibleAll students of this school are eligible for participation in authorized programs.
School District Details
- Mesquite Independent School District (ISD)
- Per-Pupil Spending: $7,320
- Graduation Rate: 80.7%
- Dropout Rate: 1.5%
- Students Per Teacher: 16.1
- Enrolled Students: 37,272
Faculty Details and Student Enrollment
Students and Faculty
- Total Students Enrolled: 740
- Total Full Time "Equivalent" Teachers: 41.6
- Average Student-To-Teacher Ratio: 17.8
Students Gender Breakdown
- Males: 367 (49.6%)
- Females: 373 (50.4%)
Free Lunch Student Eligibility Breakdown
- Eligible for Reduced Lunch: 77 (10.4%)
- Eligible for Free Lunch: 352 (47.6%)
- Eligible for Either Reduced or Free Lunch: 429 (58.0%)
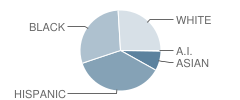
Student Enrollment Distribution by Race / Ethnicity
| Number | Percent | |
|---|---|---|
| American Indian | 2 | 0.3% |
| Black | 216 | 29.2% |
| Asian | 58 | 7.8% |
| Hispanic | 272 | 36.8% |
| White | 192 | 25.9% |
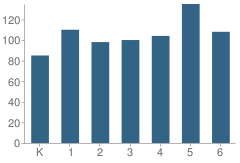
Number of Students Per Grade
| Number | Percent | |
|---|---|---|
| Kindergarten | 85 | 11.5% |
| 1st Grade | 110 | 14.9% |
| 2nd Grade | 98 | 13.2% |
| 3rd Grade | 100 | 13.5% |
| 4th Grade | 104 | 14.1% |
| 5th Grade | 135 | 18.2% |
| 6th Grade | 108 | 14.6% |
Faculty Breakdown (2010)
Average Teacher Experience
School:
9.6
District:
9.7
State:
11.3
Percent of Teachers With 1-5 Years Experience
School:
33.9%
District:
39.6%
State:
31.0%
Percent of Teachers With 6-10 Years Experience
School:
15.9%
District:
20.5%
State:
20.3%
Percent of Teachers With 11-20 Years Experience
School:
19.2%
District:
18.7%
State:
24.4%
Percent of Teachers With Greater Than 20 Years Experience
School:
14.1%
District:
14.3%
State:
18.3%
Faculty Salary (2010)
School Administration Average Base Salary
School:
$61,590
District:
$71,502
State:
$70,209
Teacher Average Base Salary
School:
$50,266
District:
$50,464
State:
$48,263
Beginning Teacher Average Base Salary
School:
$46,114
District:
$45,711
State:
$41,165
Teacher With 1-5 Years Experience Average Base Salary
School:
$46,761
State:
$43,527
Teacher With 6-10 Years Experience Average Base Salary
School:
$48,286
State:
$46,149
Teacher With 11-20 Years Experience Average Base Salary
School:
$52,125
State:
$50,153
Teacher With Greater Than 20 Years Experience Average Base Salary
School:
$63,387
State:
$58,427
Source: TX Department of Education, Source: NCES 2009-2010
School Ratings and Reviews
Overall Rating: 1

1 out of 5 | 1 Review
The Overall Rating is the school's average rating from parents, students, school faculty and staff. The highest rating is five apples and the lowest is one apple.
Share Your Review About This School
1 review for Shaw Elementary School
- Reviewed by Parent/Guardian on October 26, 2010
- Rating:
 (1 / 5) Flag as inappropriate
 - the principal is just rude
School Map and Similar Schools Nearby
Click to Activate Map of Nearby School Campuses
Private
Public
This School
Similar Schools Nearby
| Sunnyvale Middle School 5-8 | 360 Students | 0.8 miles away | Not Yet Rated | |
| Black Elementary School PK-6 | 615 Students | 1.2 miles away |  5 out of 5 | |
| Rutherford Elementary School KG-5 | 506 Students | 1.5 miles away | Not Yet Rated | |
| Hanby Elementary School PK-5 | 837 Students | 1.8 miles away | Not Yet Rated | |
| Tisinger Elementary School PK-5 | 811 Students | 1.9 miles away | Not Yet Rated | |
| Sunnyvale Elementary School PK-4 | 401 Students | 2.0 miles away | Not Yet Rated | |
| Pirrung Elementary School PK-5 | 539 Students | 2.0 miles away | Not Yet Rated | |
| Smith Elementary School KG-5 | 530 Students | 2.1 miles away | Not Yet Rated | |
| Moss Elementary School KG-6 | 574 Students | 2.2 miles away | Not Yet Rated | |
| Gentry Elementary School PK-6 | 726 Students | 2.6 miles away | Not Yet Rated | |
Compare This School To Nearby Schools ->
School Community Forum

Join a discussion about Shaw Elementary School and talk to others in the community including students, parents, teachers, and administrators.
Popular Discussion Topics
- Admissions and Registration Questions (e.g. Dress Code and Discipline Policy)
- School Calendar and Upcoming Events (e.g. Graduation)
- After School Programs, Extracurricular Activities, and Athletics (e.g. Football)
- News and Announcements (e.g. Yearbook and Class Supply List Details)
- Graduate and Alumni Events (e.g. Organizing Class Reunions)
Navigation
Can't Find What You Are Looking For?
Nearby Cities
Sponsored Links
K-12 Articles

Teaching Your Child Study Skills
Many children who have the capability to get good grades experience frustration because of low...
Many children who have the capability to get good grades experience frustration because of low...

Tips for Purchasing Back to School Supplies
In just a few days, kids from all over the US will be going back to school. Now is the time to take...
In just a few days, kids from all over the US will be going back to school. Now is the time to take...

Homework Helps
School has started throughout the country and is well into the first month-some schools are...
School has started throughout the country and is well into the first month-some schools are...