Oceana High School

No Reviews Yet
Find Old Friends From Oceana High School
Use the form below to search for alumni from Oceana High School.
School Description
School Summary and Highlights
- Enrolls 545 high school students from grades 9-12
- 2010 Overall School AYP Met Status: Yes
Additional Contact Information
- Mailing Address: 401 Paloma Ave., Pacifica, CA 94044
School Operational Details
- Alternative School
School District Details
- Jefferson Union High School District
- Per-Pupil Spending: $8,886
- Dropout Rate: 2.4%
- Students Per Teacher: 21.7
- Enrolled Students: 5,134
Faculty Details and Student Enrollment
Students and Faculty
- Total Students Enrolled: 545
- Total Full Time "Equivalent" Teachers: 24.4
- Average Student-To-Teacher Ratio: 22.3
Students Gender Breakdown
- Males: 301 (55.2%)
- Females: 244 (44.8%)
Free Lunch Student Eligibility Breakdown
- Eligible for Reduced Lunch: 57 (10.5%)
- Eligible for Free Lunch: 107 (19.6%)
- Eligible for Either Reduced or Free Lunch: 164 (30.1%)
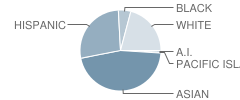
Student Enrollment Distribution by Race / Ethnicity

| Number | Percent | |
|---|---|---|
| American Indian | 4 | 0.7% |
| Black | 26 | 4.8% |
| Asian | 232 | 42.6% |
| Hispanic | 138 | 25.3% |
| White | 106 | 19.4% |
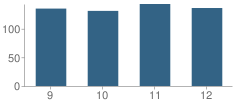
Number of Students Per Grade

| Number | Percent | |
|---|---|---|
| 9th Grade | 135 | 24.8% |
| 10th Grade | 131 | 24.0% |
| 11th Grade | 143 | 26.2% |
| 12th Grade | 136 | 25.0% |
Graduates Information (2010)
Graduation Rate
School:
91.7%
District:
85.1%
State:
78.6%
Teacher Education Background (2009)
Percent With Ph.D.: 4.0%
Percent With Master's Degree: 4.0%
Percent With Bachelor's Degree: 8.0%
Teacher Credentials & Experience (2009)
Percent of Teachers With Credentials: 100.0%
Number of Certificated Staff: 25.0
Average Number of Years of Teacher Experience: 8.3
Average Age: 41.2
Source: CA Department of Education, Source: NCES 2009-2010
School Ratings and Reviews
Be The First To Review Oceana High School!
Sponsored Links
Test Scores and Performance Information
Overall School Rating
How is this determined?
The overall school rating shows that Oceana High School performed on average about the same as other schools across the state on CST state exams in the following subjects:
- CST Algebra I
- CST Algebra II
- CST Biology
- CST Chemistry
- CST Earth Science
- CST English-Language Arts
- CST Geometry
- CST Physics
- CST Science
- CST Summative High School Math
- CST U.S. History
- CST World History
AYP Results (2010)
Overall AYP Met: Yes
ELA AYP Met: Yes
Math AYP Met: Yes
ACT Exam Results (2009)
Percent of Students Taking ACT Exam: 6.9%
SAT Exam Results (2009)
Percent of Students Taking SAT Exam: 42.6%
Average Combined Score: 1,481.6
Critical Reading Average: 482.8
Math Average: 517.4
Writing Average: 481.4
Percent Scoring At or Above 1500: 44.2%
CST - Test Proficiency by Grade and Subject
Grade 9 - % of students at or above proficiency
| School | District | State | |
|---|---|---|---|
| CST Algebra I Test | |||
| 2010 | 23.0% | 18.0% | 22.0% |
| 2009 | 7.0% | 17.0% | 21.0% |
| 2008 | 20.0% | 17.0% | 18.0% |
| CST Earth Science Test | |||
| 2010 | 47.0% | 36.0% | 35.0% |
| 2009 | 35.0% | 32.0% | 29.0% |
| 2008 | 50.0% | 34.0% | 31.0% |
| CST English-Language Arts Test | |||
| 2010 | 67.0% | 54.0% | 54.0% |
| 2009 | 61.0% | 55.0% | 50.0% |
| 2008 | 66.0% | 55.0% | 49.0% |
| CST Geometry Test | |||
| 2010 | 27.0% | 50.0% | 46.0% |
| 2009 | 47.0% | 65.0% | 47.0% |
| 2008 | 85.0% | 67.0% | 43.0% |
Grade 10 - % of students at or above proficiency
| School | District | State | |
|---|---|---|---|
| CST Algebra II Test | |||
| 2010 | 79.0% | 56.0% | 40.0% |
| 2009 | 79.0% | 52.0% | 37.0% |
| 2008 | 47.0% | 48.0% | 36.0% |
| CST Biology Test | |||
| 2010 | 33.0% | 34.0% | 38.0% |
| 2009 | 42.0% | 31.0% | 34.0% |
| 2008 | 35.0% | 29.0% | 35.0% |
| CST English-Language Arts Test | |||
| 2010 | 58.0% | 48.0% | 45.0% |
| 2009 | 60.0% | 50.0% | 44.0% |
| 2008 | 55.0% | 42.0% | 41.0% |
| CST Geometry Test | |||
| 2010 | 3.0% | 20.0% | 14.0% |
| 2009 | 9.0% | 18.0% | 14.0% |
| 2008 | 6.0% | 13.0% | 12.0% |
| CST Science Test | |||
| 2010 | 43.0% | 49.0% | 46.0% |
| 2009 | 54.0% | 48.0% | 44.0% |
| 2008 | 46.0% | 41.0% | 40.0% |
| CST World History Test | |||
| 2010 | 38.0% | 47.0% | 42.0% |
| 2009 | 46.0% | 48.0% | 38.0% |
| 2008 | 48.0% | 38.0% | 33.0% |
Grade 11 - % of students at or above proficiency
| School | District | State | |
|---|---|---|---|
| CST Algebra II Test | |||
| 2010 | 46.0% | 22.0% | 14.0% |
| 2009 | 30.0% | 14.0% | 12.0% |
| 2008 | 11.0% | 11.0% | 11.0% |
| CST Biology Test | |||
| 2010 | 21.0% | 36.0% | 46.0% |
| 2009 | 25.0% | 29.0% | 41.0% |
| 2008 | 35.0% | 36.0% | 39.0% |
| CST Chemistry Test | |||
| 2010 | 32.0% | 36.0% | 30.0% |
| 2009 | 23.0% | 32.0% | 27.0% |
| 2008 | 37.0% | 35.0% | 25.0% |
| CST English-Language Arts Test | |||
| 2010 | 65.0% | 44.0% | 42.0% |
| 2009 | 57.0% | 42.0% | 40.0% |
| 2008 | 50.0% | 41.0% | 37.0% |
| CST Geometry Test | |||
| 2010 | 6.0% | 12.0% | 6.0% |
| CST Physics Test | |||
| 2010 | 31.0% | 47.0% | 53.0% |
| 2009 | 17.0% | 44.0% | 50.0% |
| 2008 | 24.0% | 33.0% | 47.0% |
| CST Summative High School Math Test | |||
| 2010 | 64.0% | 54.0% | 50.0% |
| 2009 | 44.0% | 50.0% | 47.0% |
| 2008 | 32.0% | 42.0% | 43.0% |
| CST U.S. History Test | |||
| 2010 | 61.0% | 47.0% | 45.0% |
| 2009 | 58.0% | 42.0% | 44.0% |
| 2008 | 38.0% | 35.0% | 38.0% |
End of Course - % of students at or above proficiency
| School | District | State | |
|---|---|---|---|
| CST Algebra I Test | |||
| 2010 | 20.0% | 15.0% | 31.0% |
| 2009 | 5.0% | 15.0% | 28.0% |
| 2008 | 15.0% | 13.0% | 25.0% |
| CST Algebra II Test | |||
| 2010 | 59.0% | 37.0% | 31.0% |
| 2009 | 52.0% | 30.0% | 28.0% |
| 2008 | 32.0% | 27.0% | 27.0% |
| CST Biology Test | |||
| 2010 | 32.0% | 41.0% | 46.0% |
| 2009 | 40.0% | 37.0% | 42.0% |
| 2008 | 36.0% | 39.0% | 42.0% |
| CST Chemistry Test | |||
| 2010 | 32.0% | 43.0% | 38.0% |
| 2009 | 23.0% | 37.0% | 36.0% |
| 2008 | 36.0% | 38.0% | 32.0% |
| CST Earth Science Test | |||
| 2010 | 47.0% | 31.0% | 33.0% |
| 2009 | 35.0% | 28.0% | 28.0% |
| 2008 | 50.0% | 30.0% | 28.0% |
| CST Geometry Test | |||
| 2010 | 13.0% | 29.0% | 27.0% |
| 2009 | 19.0% | 31.0% | 26.0% |
| 2008 | 34.0% | 30.0% | 24.0% |
| CST Physics Test | |||
| 2010 | 32.0% | 58.0% | 49.0% |
| 2009 | 17.0% | 58.0% | 46.0% |
| 2008 | 24.0% | 54.0% | 43.0% |
| CST Summative High School Math Test | |||
| 2010 | 64.0% | 54.0% | 54.0% |
| 2009 | 44.0% | 49.0% | 50.0% |
| 2008 | 35.0% | 42.0% | 47.0% |
| CST World History Test | |||
| 2010 | 38.0% | 46.0% | 41.0% |
| 2009 | 45.0% | 47.0% | 38.0% |
| 2008 | 47.0% | 38.0% | 33.0% |
Source: CA Department of Education 2009-2010
School Map and Similar Schools Nearby
Click to Activate Map of Nearby School Campuses
Private
Public
This School
Similar Schools Nearby
| Baden High (Continuation) School 9-12 | 161 Students | 3.0 miles away | Not Yet Rated | |
| North Community School 9-12 | 31 Students | 3.7 miles away | Not Yet Rated | - |
| Thornton High School 9-12 | 226 Students | 4.0 miles away | Not Yet Rated | |
| June Jordan School for Equity 9-12 | 265 Students | 6.7 miles away | Not Yet Rated | |
| Independence High (Alternative) School 9-12 | 368 Students | 7.4 miles away | Not Yet Rated | |
| San Francisco County Court Woodside Learning Center School 6-12 | 150 Students | 7.8 miles away | Not Yet Rated | |
| Academy of Arts and Sciences 9-12 | 337 Students | 7.8 miles away | Not Yet Rated | - |
| San Francisco County Alternative / Opportunity School 6-12 | 73 Students | 8.9 miles away | Not Yet Rated | |
| Sf International High School 9-12 | 60 Students | 9.2 miles away | Not Yet Rated | - |
| Downtown High (Continuation) School 9-12 | 239 Students | 9.7 miles away | Not Yet Rated | |
Compare This School To Nearby Schools ->
School Community Forum

Join a discussion about Oceana High School and talk to others in the community including students, parents, teachers, and administrators.
Popular Discussion Topics
- Admissions and Registration Questions (e.g. Dress Code and Discipline Policy)
- School Calendar and Upcoming Events (e.g. Graduation)
- After School Programs, Extracurricular Activities, and Athletics (e.g. Football)
- News and Announcements (e.g. Yearbook and Class Supply List Details)
- Graduate and Alumni Events (e.g. Organizing Class Reunions)
Navigation
Can't Find What You Are Looking For?
Rankings
Nearby Cities
Sponsored Links
K-12 Articles
Cell Phones... the Best Thing Since Sliced Bread or the Worst Invention in the World?
Cell phones are wonderful, the best things humans have ever invented! They help us keep in touch...
Strategies to Help Kids Cope with Stress
Many parents believe that kids don't experience stress. Nothing could be further from the truth....
All About Backpacks
Your child riffles through his backpack to find homework assignments, his MP3 player, lunch money...
