Westmoor High School

No Reviews Yet
Find Old Friends From Westmoor High School
Use the form below to search for alumni from Westmoor High School.
School Description
School Summary and Highlights
- Enrolls 1,817 high school students from grades 9-12
- Ranks 239th out of 1,197 high schools in CA.
- 2010 Overall School AYP Met Status: No
Additional Contact Information
- Mailing Address: 131 Westmoor Ave., Daly City, CA 94015
School District Details
- Jefferson Union High School District
- Per-Pupil Spending: $8,886
- Dropout Rate: 2.4%
- Students Per Teacher: 21.7
- Enrolled Students: 5,134
Faculty Details and Student Enrollment
Students and Faculty
- Total Students Enrolled: 1,817
- Total Full Time "Equivalent" Teachers: 74.8
- Average Student-To-Teacher Ratio: 24.3
Students Gender Breakdown
- Males: 945 (52.0%)
- Females: 872 (48.0%)
Free Lunch Student Eligibility Breakdown
- Eligible for Reduced Lunch: 199 (11.0%)
- Eligible for Free Lunch: 394 (21.7%)
- Eligible for Either Reduced or Free Lunch: 593 (32.6%)
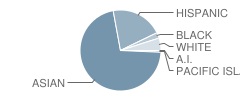
Student Enrollment Distribution by Race / Ethnicity

| Number | Percent | |
|---|---|---|
| American Indian | 3 | 0.2% |
| Black | 40 | 2.2% |
| Asian | 1,243 | 68.4% |
| Hispanic | 361 | 19.9% |
| White | 87 | 4.8% |
Number of Students Per Grade

| Number | Percent | |
|---|---|---|
| 9th Grade | 440 | 24.2% |
| 10th Grade | 480 | 26.4% |
| 11th Grade | 462 | 25.4% |
| 12th Grade | 435 | 23.9% |
Graduates Information (2010)
Graduation Rate
School:
92.0%
District:
85.1%
State:
78.6%
Teacher Education Background (2009)
Percent With Ph.D.: 4.8%
Percent With Master's Degree: 4.8%
Percent With Bachelor's Degree: 8.3%
Teacher Credentials & Experience (2009)
Percent of Teachers With Emergency Credentials: 1.2%
Percent of Teachers With Credentials: 95.2%
Number of Certificated Staff: 84.0
Average Number of Years of Teacher Experience: 10.7
Average Age: 46.0
Source: CA Department of Education, Source: NCES 2009-2010
School Ratings and Reviews
Be The First To Review Westmoor High School!
Sponsored Links
Test Scores and Performance Information
Overall School Rating
How is this determined?
The overall school rating shows that Westmoor High School performed on average better than many other schools across the state on CST state exams in the following subjects:
- CST Algebra I
- CST Algebra II
- CST Biology
- CST Chemistry
- CST Earth Science
- CST English-Language Arts
- CST Geometry
- CST Integrated Math 1
- CST Physics
- CST Science
- CST Summative High School Math
- CST U.S. History
- CST World History
AYP Results (2010)
Overall AYP Met: No
ELA AYP Met: Yes
Math AYP Met: No
ACT Exam Results (2009)
Percent of Students Taking ACT Exam: 7.5%
Average Combined Score: 21.7
Percent Scoring At or Above 21: 64.3%
SAT Exam Results (2009)
Percent of Students Taking SAT Exam: 51.5%
Average Combined Score: 1,505.3
Critical Reading Average: 486.3
Math Average: 531.6
Writing Average: 487.4
Percent Scoring At or Above 1500: 50.0%
CST - Test Proficiency by Grade and Subject
Grade 9 - % of students at or above proficiency
| School | District | State | |
|---|---|---|---|
| CST Algebra I Test | |||
| 2010 | 33.0% | 18.0% | 22.0% |
| 2009 | 23.0% | 17.0% | 21.0% |
| 2008 | 20.0% | 17.0% | 18.0% |
| CST Biology Test | |||
| 2010 | 87.0% | 73.0% | 55.0% |
| 2009 | 75.0% | 68.0% | 51.0% |
| 2008 | 84.0% | 75.0% | 52.0% |
| CST Earth Science Test | |||
| 2010 | 37.0% | 36.0% | 35.0% |
| 2009 | 27.0% | 32.0% | 29.0% |
| 2008 | 29.0% | 34.0% | 31.0% |
| CST English-Language Arts Test | |||
| 2010 | 61.0% | 54.0% | 54.0% |
| 2009 | 61.0% | 55.0% | 50.0% |
| 2008 | 61.0% | 55.0% | 49.0% |
| CST Geometry Test | |||
| 2010 | 85.0% | 50.0% | 46.0% |
| 2009 | 84.0% | 65.0% | 47.0% |
| 2008 | 77.0% | 67.0% | 43.0% |
Grade 10 - % of students at or above proficiency
| School | District | State | |
|---|---|---|---|
| CST Algebra I Test | |||
| 2010 | 16.0% | 10.0% | 12.0% |
| 2009 | 12.0% | 10.0% | 11.0% |
| 2008 | 13.0% | 8.0% | 9.0% |
| CST Algebra II Test | |||
| 2010 | 79.0% | 56.0% | 40.0% |
| 2009 | 65.0% | 52.0% | 37.0% |
| 2008 | 75.0% | 48.0% | 36.0% |
| CST Biology Test | |||
| 2010 | 39.0% | 34.0% | 38.0% |
| 2009 | 33.0% | 31.0% | 34.0% |
| 2008 | 36.0% | 29.0% | 35.0% |
| CST English-Language Arts Test | |||
| 2010 | 52.0% | 48.0% | 45.0% |
| 2009 | 57.0% | 50.0% | 44.0% |
| 2008 | 49.0% | 42.0% | 41.0% |
| CST Geometry Test | |||
| 2010 | 36.0% | 20.0% | 14.0% |
| 2009 | 33.0% | 18.0% | 14.0% |
| 2008 | 19.0% | 13.0% | 12.0% |
| CST Physics Test | |||
| 2010 | 78.0% | 77.0% | 44.0% |
| 2009 | 76.0% | 76.0% | 40.0% |
| 2008 | 79.0% | 76.0% | 36.0% |
| CST Science Test | |||
| 2010 | 53.0% | 49.0% | 46.0% |
| 2009 | 52.0% | 48.0% | 44.0% |
| 2008 | 46.0% | 41.0% | 40.0% |
| CST World History Test | |||
| 2010 | 60.0% | 47.0% | 42.0% |
| 2009 | 60.0% | 48.0% | 38.0% |
| 2008 | 50.0% | 38.0% | 33.0% |
| CST Earth Science Test | |||
| 2009 | 5.0% | 11.0% | 23.0% |
| 2008 | 3.0% | 10.0% | 23.0% |
| CST Integrated Math 1 Test | |||
| 2008 | 5.0% | 16.0% | 10.0% |
Grade 11 - % of students at or above proficiency
| School | District | State | |
|---|---|---|---|
| CST Algebra I Test | |||
| 2010 | 11.0% | 9.0% | 8.0% |
| 2009 | 17.0% | 7.0% | 8.0% |
| 2008 | 3.0% | 3.0% | 5.0% |
| CST Algebra II Test | |||
| 2010 | 31.0% | 22.0% | 14.0% |
| 2009 | 21.0% | 14.0% | 12.0% |
| 2008 | 25.0% | 11.0% | 11.0% |
| CST Biology Test | |||
| 2010 | 35.0% | 36.0% | 46.0% |
| 2009 | 30.0% | 29.0% | 41.0% |
| 2008 | 42.0% | 36.0% | 39.0% |
| CST Chemistry Test | |||
| 2010 | 58.0% | 36.0% | 30.0% |
| 2009 | 48.0% | 32.0% | 27.0% |
| 2008 | 41.0% | 35.0% | 25.0% |
| CST Earth Science Test | |||
| 2010 | 17.0% | 14.0% | 32.0% |
| 2009 | 11.0% | 10.0% | 26.0% |
| 2008 | 15.0% | 10.0% | 28.0% |
| CST English-Language Arts Test | |||
| 2010 | 51.0% | 44.0% | 42.0% |
| 2009 | 50.0% | 42.0% | 40.0% |
| 2008 | 49.0% | 41.0% | 37.0% |
| CST Geometry Test | |||
| 2010 | 2.0% | 12.0% | 6.0% |
| 2009 | 18.0% | 10.0% | 7.0% |
| 2008 | 16.0% | 7.0% | 6.0% |
| CST Physics Test | |||
| 2010 | 59.0% | 47.0% | 53.0% |
| 2009 | 71.0% | 44.0% | 50.0% |
| 2008 | 57.0% | 33.0% | 47.0% |
| CST Summative High School Math Test | |||
| 2010 | 68.0% | 54.0% | 50.0% |
| 2009 | 67.0% | 50.0% | 47.0% |
| 2008 | 50.0% | 42.0% | 43.0% |
| CST U.S. History Test | |||
| 2010 | 57.0% | 47.0% | 45.0% |
| 2009 | 49.0% | 42.0% | 44.0% |
| 2008 | 46.0% | 35.0% | 38.0% |
| CST World History Test | |||
| 2010 | 8.0% | 9.0% | 15.0% |
| CST Integrated Math 1 Test | |||
| 2009 | 4.0% | 4.0% | 9.0% |
| 2008 | 10.0% | 12.0% | 9.0% |
End of Course - % of students at or above proficiency
| School | District | State | |
|---|---|---|---|
| CST Algebra I Test | |||
| 2010 | 24.0% | 15.0% | 31.0% |
| 2009 | 20.0% | 15.0% | 28.0% |
| 2008 | 16.0% | 13.0% | 25.0% |
| CST Algebra II Test | |||
| 2010 | 53.0% | 37.0% | 31.0% |
| 2009 | 44.0% | 30.0% | 28.0% |
| 2008 | 50.0% | 27.0% | 27.0% |
| CST Biology Test | |||
| 2010 | 45.0% | 41.0% | 46.0% |
| 2009 | 41.0% | 37.0% | 42.0% |
| 2008 | 49.0% | 39.0% | 42.0% |
| CST Chemistry Test | |||
| 2010 | 58.0% | 43.0% | 38.0% |
| 2009 | 48.0% | 37.0% | 36.0% |
| 2008 | 41.0% | 38.0% | 32.0% |
| CST Earth Science Test | |||
| 2010 | 33.0% | 31.0% | 33.0% |
| 2009 | 23.0% | 28.0% | 28.0% |
| 2008 | 25.0% | 30.0% | 28.0% |
| CST Geometry Test | |||
| 2010 | 44.0% | 29.0% | 27.0% |
| 2009 | 50.0% | 31.0% | 26.0% |
| 2008 | 43.0% | 30.0% | 24.0% |
| CST Physics Test | |||
| 2010 | 69.0% | 58.0% | 49.0% |
| 2009 | 74.0% | 58.0% | 46.0% |
| 2008 | 75.0% | 54.0% | 43.0% |
| CST Summative High School Math Test | |||
| 2010 | 68.0% | 54.0% | 54.0% |
| 2009 | 66.0% | 49.0% | 50.0% |
| 2008 | 51.0% | 42.0% | 47.0% |
| CST World History Test | |||
| 2010 | 58.0% | 46.0% | 41.0% |
| 2009 | 58.0% | 47.0% | 38.0% |
| 2008 | 50.0% | 38.0% | 33.0% |
| CST Integrated Math 1 Test | |||
| 2009 | 3.0% | 5.0% | 11.0% |
| 2008 | 8.0% | 12.0% | 11.0% |
Source: CA Department of Education 2009-2010
School Map and Similar Schools Nearby
Click to Activate Map of Nearby School Campuses
Private
Public
This School
Similar Schools Nearby
| Jefferson High School 9-12 | 1,179 Students | 1.3 miles away | Not Yet Rated | |
| El Camino High School 9-12 | 1,483 Students | 2.6 miles away | ![]() 5 out of 5 | |
| Lowell High School 9-12 | 2,597 Students | 3.3 miles away | ![]() 5 out of 5 | |
| Balboa High School 9-12 | 1,295 Students | 3.6 miles away | ![]() 1 out of 5 | |
| South San Francisco High School 9-12 | 1,517 Students | 4.0 miles away | Not Yet Rated | |
| Abraham Lincoln High School 9-12 | 2,346 Students | 4.4 miles away | Not Yet Rated | |
| School of the Arts 9-12 | 591 Students | 4.7 miles away | Not Yet Rated | |
| Phillip and Sala Burton Academic High School 9-12 | 813 Students | 5.1 miles away | Not Yet Rated | |
| Newcomer High School 9-12 | 156 Students | 5.6 miles away | Not Yet Rated | |
| Thurgood Marshall Academic High School 9-12 | 817 Students | 5.8 miles away | Not Yet Rated | |
Compare This School To Nearby Schools ->
School Community Forum

Join a discussion about Westmoor High School and talk to others in the community including students, parents, teachers, and administrators.
Popular Discussion Topics
- Admissions and Registration Questions (e.g. Dress Code and Discipline Policy)
- School Calendar and Upcoming Events (e.g. Graduation)
- After School Programs, Extracurricular Activities, and Athletics (e.g. Football)
- News and Announcements (e.g. Yearbook and Class Supply List Details)
- Graduate and Alumni Events (e.g. Organizing Class Reunions)
Navigation
Can't Find What You Are Looking For?
Rankings
Nearby Cities
Sponsored Links
K-12 Articles
Teaching Children with Learning Disabilities to Make Friends
Children with learning disabilities often have trouble making and retaining friendships. Some kids...
Cut the Credit and Save You Some Money
Today's society glorifies a get-it-now mentality. Children learn this early. You probably noticed...
The First Day of School
The first day of kindergarten is a rite of passage for any student. Every mother cries and...


