John Swett High School
Rating
Not Available
Not Available

No Reviews Yet
Find Old Friends From John Swett High School
Use the form below to search for alumni from John Swett High School.
School Description
School Summary and Highlights
- Enrolls 524 high school students from grades 9-12
- Ranks 667th out of 1,197 high schools in CA.
- 2010 Overall School AYP Met Status: No
Additional Contact Information
- Mailing Address: 1098 Pomona St., Crockett, CA 94525
School District Details
- John Swett Unified School District
- Per-Pupil Spending: $9,291
- Graduation Rate: 69.0%
- Dropout Rate: 8.1%
- Students Per Teacher: 19.0
- Enrolled Students: 1,664
Faculty Details and Student Enrollment
Students and Faculty
- Total Students Enrolled: 524
- Total Full Time "Equivalent" Teachers: 24.7
- Average Student-To-Teacher Ratio: 21.2
Students Gender Breakdown
- Males: 276 (52.7%)
- Females: 248 (47.3%)
Free Lunch Student Eligibility Breakdown
- Eligible for Reduced Lunch: 44 (8.4%)
- Eligible for Free Lunch: 125 (23.9%)
- Eligible for Either Reduced or Free Lunch: 169 (32.3%)
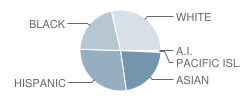
Student Enrollment Distribution by Race / Ethnicity
| Number | Percent | |
|---|---|---|
| American Indian | 2 | 0.4% |
| Black | 101 | 19.3% |
| Asian | 106 | 20.2% |
| Hispanic | 134 | 25.6% |
| White | 138 | 26.3% |
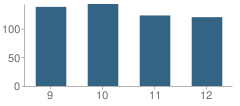
Number of Students Per Grade
| Number | Percent | |
|---|---|---|
| 9th Grade | 138 | 26.3% |
| 10th Grade | 143 | 27.3% |
| 11th Grade | 123 | 23.5% |
| 12th Grade | 120 | 22.9% |
Graduates Information (2010)
Graduation Rate
School:
83.1%
District:
80.1%
State:
78.6%
Teacher Education Background (2009)
Percent With Master's Degree
School:
24.2%
District:
33.3%
Percent With Bachelor's Degree: 6.1%
Percent With Ph.D.
School:
3.0%
District:
33.3%
Teacher Credentials & Experience (2009)
Average Age
School:
45.0
District:
51.0
Average Number of Years of Teacher Experience: 14.3
Number of Certificated Staff: 33.0
Percent of Teachers With Credentials: 89.7%
Source: CA Department of Education, Source: NCES 2009-2010
School Ratings and Reviews
Be The First To Review John Swett High School!
School Map and Similar Schools Nearby
Click to Activate Map of Nearby School Campuses
Private
Public
This School
Similar Schools Nearby
| Benicia High School 9-12 | 1,671 Students | 2.7 miles away | Not Yet Rated | |
| Hogan High School 9-12 | 1,361 Students | 3.3 miles away |  3.5 out of 5 | |
| Hercules High School 9-12 | 1,008 Students | 4.1 miles away |  4 out of 5 | |
| Vallejo High School 9-12 | 1,666 Students | 4.3 miles away |  3 out of 5 | |
| Jesse M. Bethel High School 9-12 | 1,494 Students | 4.5 miles away | 4 out of 5 | |
| Martinez Junior High School 6-8 | 918 Students | 5.5 miles away | Not Yet Rated | |
| Pinole Valley High School 9-12 | 1,622 Students | 5.6 miles away | Not Yet Rated | |
| Alhambra High School 9-12 | 1,280 Students | 5.9 miles away |  5 out of 5 | |
| Crespi Junior High School 7-8 | 581 Students | 6.7 miles away | Not Yet Rated | |
| De Anza High School 9-12 | 907 Students | 6.9 miles away | 5 out of 5 | |
Compare This School To Nearby Schools ->
School Community Forum

Join a discussion about John Swett High School and talk to others in the community including students, parents, teachers, and administrators.
Popular Discussion Topics
- Admissions and Registration Questions (e.g. Dress Code and Discipline Policy)
- School Calendar and Upcoming Events (e.g. Graduation)
- After School Programs, Extracurricular Activities, and Athletics (e.g. Football)
- News and Announcements (e.g. Yearbook and Class Supply List Details)
- Graduate and Alumni Events (e.g. Organizing Class Reunions)
Navigation
Can't Find What You Are Looking For?
Rankings
Nearby Cities
Sponsored Links
K-12 Articles

Educators and Childhood Obesity
Obesity in childhood is rising to epidemic proportions in America and educators should be...
Obesity in childhood is rising to epidemic proportions in America and educators should be...

Strategies to Help Kids Cope with Stress
Many parents believe that kids don’t experience stress. Nothing could be further from the truth....
Many parents believe that kids don’t experience stress. Nothing could be further from the truth....

Does Your Child's Teacher Make a Difference
School improvement is always in the news. Teachers demand smaller class sizes. The government calls...
School improvement is always in the news. Teachers demand smaller class sizes. The government calls...