Millsap High School
Rating
Not Available
Not Available

No Reviews Yet
Find Old Friends From Millsap High School
Use the form below to search for alumni from Millsap High School.
School Description
School Summary and Highlights
- Enrolls 269 high school students from grades 9-12
- Ranks 647th out of 1,325 high schools in TX.
- 2010 Overall School AYP Met Status: Yes
Additional Contact Information
- Principal or Admin: Mr Matt Adams
- Fax: (940) 682-4035
- Website: www.MillsapISD.net
School District Details
- Millsap Independent School District (ISD)
- Per-Pupil Spending: $9,394
- Graduation Rate: 76.4%
- Students Per Teacher: 12.5
- Enrolled Students: 770
Faculty Details and Student Enrollment
Students and Faculty
- Total Students Enrolled: 269
- Total Full Time "Equivalent" Teachers: 23.1
- Average Student-To-Teacher Ratio: 11.7
Students Gender Breakdown
- Males: 145 (53.9%)
- Females: 124 (46.1%)
Free Lunch Student Eligibility Breakdown
- Eligible for Reduced Lunch: 41 (15.2%)
- Eligible for Free Lunch: 65 (24.2%)
- Eligible for Either Reduced or Free Lunch: 106 (39.4%)
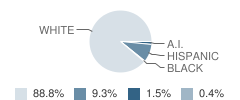
Student Enrollment Distribution by Race / Ethnicity
| Number | Percent | |
|---|---|---|
| American Indian | 4 | 1.5% |
| Black | 1 | 0.4% |
| Asian | - | - |
| Hispanic | 25 | 9.3% |
| White | 239 | 88.8% |
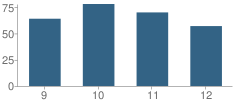
Number of Students Per Grade
| Number | Percent | |
|---|---|---|
| 9th Grade | 64 | 23.8% |
| 10th Grade | 78 | 29.0% |
| 11th Grade | 70 | 26.0% |
| 12th Grade | 57 | 21.2% |
Breakdown of College Ready Graduates (2009)
Percent Ready For College in Reading
School:
49.0%
District:
49.0%
State:
62.0%
Percent Ready For College in Math
School:
78.0%
District:
56.0%
State:
60.0%
Graduation & Dropout Rates (2009)
Graduation Rate
School:
98.5%
District:
98.5%
State:
80.6%
Dropout Rate
School:
1.5%
District:
1.5%
State:
9.4%
Faculty Breakdown (2010)
Average Teacher Experience
School:
11.4
District:
12.2
State:
11.3
Percent of Teachers With 1-5 Years Experience
School:
28.3%
District:
24.1%
State:
31.0%
Percent of Teachers With 6-10 Years Experience
School:
15.3%
District:
21.1%
State:
20.3%
Percent of Teachers With 11-20 Years Experience
School:
44.2%
District:
37.1%
State:
24.4%
Percent of Teachers With Greater Than 20 Years Experience
School:
7.9%
District:
14.4%
State:
18.3%
Faculty Salary (2010)
School Administration Average Base Salary
School:
$65,896
District:
$65,650
State:
$70,209
Teacher Average Base Salary
School:
$43,619
District:
$43,127
State:
$48,263
Beginning Teacher Average Base Salary
School:
$33,433
District:
$33,433
State:
$41,165
Teacher With 1-5 Years Experience Average Base Salary
School:
$37,023
State:
$43,527
Teacher With 6-10 Years Experience Average Base Salary
School:
$37,849
State:
$46,149
Teacher With 11-20 Years Experience Average Base Salary
School:
$48,564
State:
$50,153
Teacher With Greater Than 20 Years Experience Average Base Salary
School:
$56,320
State:
$58,427
Source: TX Department of Education, Source: NCES 2009-2010
School Ratings and Reviews
Be The First To Review Millsap High School!
School Map and Similar Schools Nearby
Click to Activate Map of Nearby School Campuses
Private
Public
This School
Similar Schools Nearby
| Mineral Wells High School 9-12 | 944 Students | 5.9 miles away | Not Yet Rated | |
| Mineral Wells Junior High School 7-8 | 517 Students | 6.2 miles away | Not Yet Rated | |
| Brock High School 9-12 | 262 Students | 6.7 miles away |  5 out of 5 | |
| Peaster High School 9-12 | 340 Students | 11.1 miles away | Not Yet Rated | |
| Weatherford High School 9-12 | 1,578 Students | 11.8 miles away | 5 out of 5 | |
| Weatherford High School Ninth Grade Center 9-10 | 579 Students | 12.1 miles away | Not Yet Rated | |
| Santo High School 6-12 | 269 Students | 15.9 miles away | 5 out of 5 | |
| Poolville Junior High School 6-8 | 108 Students | 16.6 miles away |  4 out of 5 | |
| Lipan High School 7-12 | 118 Students | 16.7 miles away | Not Yet Rated | |
| Poolville High School 9-12 | 145 Students | 16.9 miles away | Not Yet Rated | |
Compare This School To Nearby Schools ->
School Community Forum

Join a discussion about Millsap High School and talk to others in the community including students, parents, teachers, and administrators.
Popular Discussion Topics
- Admissions and Registration Questions (e.g. Dress Code and Discipline Policy)
- School Calendar and Upcoming Events (e.g. Graduation)
- After School Programs, Extracurricular Activities, and Athletics (e.g. Football)
- News and Announcements (e.g. Yearbook and Class Supply List Details)
- Graduate and Alumni Events (e.g. Organizing Class Reunions)
Navigation
Can't Find What You Are Looking For?
Nearby Cities
Sponsored Links
K-12 Articles

Cutting Class
Depression is a very real problem for today's youth. When your spirit doesn't feel good, a lot of...
Depression is a very real problem for today's youth. When your spirit doesn't feel good, a lot of...

Strategies to Help Kids Cope with Stress
Many parents believe that kids don't experience stress. Nothing could be further from the truth....
Many parents believe that kids don't experience stress. Nothing could be further from the truth....

The First Day of School
The first day of kindergarten is a rite of passage for any student. Every mother cries and...
The first day of kindergarten is a rite of passage for any student. Every mother cries and...