Clear Spring Elementary School
Rating
Not Available
Not Available

5 out of 5 | 1 Review
Find Old Friends From Clear Spring Elementary School
Use the form below to search for alumni from Clear Spring Elementary School.
School Description
School Summary and Highlights
- Enrolls 462 preschool and elementary school students from grades PK-5
- Ranks 3320th out of 4,319 elementary schools in TX.
- 2010 Overall School AYP Met Status: Yes
Additional Contact Information
- Principal or Admin: Mr Adam Schwab
- Fax: (210) 650-1582
- Website: www.neisd.net
School Operational Details
- Title I EligibleAll students of this school are eligible for participation in authorized programs.
School District Details
- North East Independent School District (ISD)
- Per-Pupil Spending: $8,329
- Graduation Rate: 82.2%
- Dropout Rate: 1.6%
- Students Per Teacher: 15.0
- Enrolled Students: 65,498
Faculty Details and Student Enrollment
Students and Faculty
- Total Students Enrolled: 462
- Total Full Time "Equivalent" Teachers: 36.2
- Average Student-To-Teacher Ratio: 12.8
Students Gender Breakdown
- Males: 220 (47.6%)
- Females: 242 (52.4%)
Free Lunch Student Eligibility Breakdown
- Eligible for Reduced Lunch: 45 (9.7%)
- Eligible for Free Lunch: 346 (74.9%)
- Eligible for Either Reduced or Free Lunch: 391 (84.6%)
Student Enrollment Distribution by Race / Ethnicity
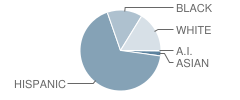
| Number | Percent | |
|---|---|---|
| American Indian | 1 | 0.2% |
| Black | 65 | 14.1% |
| Asian | 9 | 1.9% |
| Hispanic | 312 | 67.5% |
| White | 75 | 16.2% |
Number of Students Per Grade
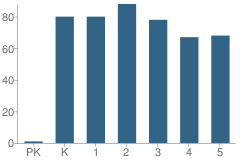
| Number | Percent | |
|---|---|---|
| Pre-Kindergarten | 1 | 0.2% |
| Kindergarten | 80 | 17.3% |
| 1st Grade | 80 | 17.3% |
| 2nd Grade | 88 | 19.0% |
| 3rd Grade | 78 | 16.9% |
| 4th Grade | 67 | 14.5% |
| 5th Grade | 68 | 14.7% |
Faculty Breakdown (2010)
Average Teacher Experience
School:
8.2
District:
11.6
State:
11.3
Percent of Teachers With 1-5 Years Experience
School:
50.2%
District:
27.3%
State:
31.0%
Percent of Teachers With 6-10 Years Experience
School:
23.5%
District:
23.7%
State:
20.3%
Percent of Teachers With 11-20 Years Experience
School:
9.7%
District:
29.0%
State:
24.4%
Percent of Teachers With Greater Than 20 Years Experience
School:
13.8%
District:
16.5%
State:
18.3%
Faculty Salary (2010)
School Administration Average Base Salary
School:
$71,067
District:
$80,941
State:
$70,209
Teacher Average Base Salary
School:
$51,727
District:
$53,487
State:
$48,263
Beginning Teacher Average Base Salary
School:
$46,940
District:
$47,074
State:
$41,165
Teacher With 1-5 Years Experience Average Base Salary
School:
$48,962
State:
$43,527
Teacher With 6-10 Years Experience Average Base Salary
School:
$51,675
State:
$46,149
Teacher With 11-20 Years Experience Average Base Salary
School:
$57,434
State:
$50,153
Teacher With Greater Than 20 Years Experience Average Base Salary
School:
$58,829
State:
$58,427
Source: TX Department of Education, Source: NCES 2009-2010
School Ratings and Reviews
Overall Rating: 5

5 out of 5 | 1 Review
The Overall Rating is the school's average rating from parents, students, school faculty and staff. The highest rating is five apples and the lowest is one apple.
Share Your Review About This School
1 review for Clear Spring Elementary School
- Reviewed by Parent/Guardian on May 16, 2009
- Rating:
 (5 / 5) Flag as inappropriate
 - Great School! We are very happy with Clear Spring. Teachers are well prepared and actually care about the kids.
School Map and Similar Schools Nearby
Click to Activate Map of Nearby School Campuses
Private
Public
This School
Similar Schools Nearby
| Serna Elementary School PK-5 | 559 Students | 0.9 miles away | Not Yet Rated | |
| Walzem Elementary School PK-5 | 720 Students | 1.5 miles away |  3 out of 5 | |
| El Dorado Elementary School PK-5 | 722 Students | 1.7 miles away | Not Yet Rated | |
| Oak Grove Elementary School PK-5 | 423 Students | 1.7 miles away |  5 out of 5 | |
| Windcrest Elementary School KG-5 | 690 Students | 1.7 miles away | Not Yet Rated | |
| Royal Ridge Elementary School PK-5 | 615 Students | 2.2 miles away | Not Yet Rated | |
| Regency Place Elementary School PK-5 | 523 Students | 2.3 miles away | Not Yet Rated | |
| Camelot Elementary School PK-5 | 596 Students | 2.3 miles away | Not Yet Rated | |
| Northwood Elementary School PK-5 | 432 Students | 2.6 miles away | Not Yet Rated | |
| Northern Hills Elementary School PK-5 | 691 Students | 2.7 miles away | 5 out of 5 | |
Compare This School To Nearby Schools ->
School Community Forum

Join a discussion about Clear Spring Elementary School and talk to others in the community including students, parents, teachers, and administrators.
Popular Discussion Topics
- Admissions and Registration Questions (e.g. Dress Code and Discipline Policy)
- School Calendar and Upcoming Events (e.g. Graduation)
- After School Programs, Extracurricular Activities, and Athletics (e.g. Football)
- News and Announcements (e.g. Yearbook and Class Supply List Details)
- Graduate and Alumni Events (e.g. Organizing Class Reunions)
Navigation
Can't Find What You Are Looking For?
Sponsored Links
K-12 Articles

Just a Harmless Vanilla Bean?
Some of the greatest, most used, and most profitable breakthroughs in science have not been made by...
Some of the greatest, most used, and most profitable breakthroughs in science have not been made by...

Help Your Child Achieve Success in Middle School
Middle school is for children between the ages of 10 and 14 years. At this time children begin to...
Middle school is for children between the ages of 10 and 14 years. At this time children begin to...

Transform Your Middle School Slacker into a Scholar
All children need motivation to learn. Have your child’s grades decreased since he started middle...
All children need motivation to learn. Have your child’s grades decreased since he started middle...