Centennial High School

No Reviews Yet
Find Old Friends From Centennial High School
Use the form below to search for alumni from Centennial High School.
School Description
School Summary and Highlights
- Enrolls 1,858 high school students from grades 9-12
- Ranks 178th out of 1,197 high schools in CA.
- 2010 Overall School AYP Met Status: Yes
Additional Contact Information
- Mailing Address: 8601 Hageman Rd., Bakersfield, CA 93312
School District Details
- Kern Union High School District
- Per-Pupil Spending: $9,427
- Dropout Rate: 5.3%
- Students Per Teacher: 25.6
- Enrolled Students: 37,928
Faculty Details and Student Enrollment
Students and Faculty
- Total Students Enrolled: 1,858
- Total Full Time "Equivalent" Teachers: 72.4
- Average Student-To-Teacher Ratio: 25.7
Students Gender Breakdown
- Males: 948 (51.0%)
- Females: 910 (49.0%)
Free Lunch Student Eligibility Breakdown
- Eligible for Reduced Lunch: 88 (4.7%)
- Eligible for Free Lunch: 397 (21.4%)
- Eligible for Either Reduced or Free Lunch: 485 (26.1%)
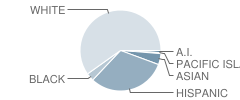
Student Enrollment Distribution by Race / Ethnicity

| Number | Percent | |
|---|---|---|
| American Indian | 18 | 1.0% |
| Black | 61 | 3.3% |
| Asian | 84 | 4.5% |
| Hispanic | 577 | 31.1% |
| White | 1,097 | 59.0% |
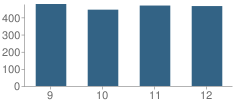
Number of Students Per Grade

| Number | Percent | |
|---|---|---|
| 9th Grade | 478 | 25.7% |
| 10th Grade | 445 | 24.0% |
| 11th Grade | 469 | 25.2% |
| 12th Grade | 466 | 25.1% |
Graduates Information (2010)
Graduation Rate
School:
83.4%
District:
78.6%
State:
78.6%
Teacher Education Background (2009)
Percent With Ph.D.
School:
1.1%
District:
8.8%
Percent With Master's Degree
School:
49.4%
District:
54.4%
Percent With Bachelor's Degree
School:
3.4%
District:
2.9%
Teacher Credentials & Experience (2009)
Percent of Teachers With Credentials: 98.7%
Number of Certificated Staff: 87.0
Average Number of Years of Teacher Experience: 15.3
Average Age
School:
42.0
District:
49.1
Source: CA Department of Education, Source: NCES 2009-2010
School Ratings and Reviews
Be The First To Review Centennial High School!
Sponsored Links
Test Scores and Performance Information
Overall School Rating
How is this determined?
The overall school rating shows that Centennial High School performed on average better than many other schools across the state on CST state exams in the following subjects:
- CST Algebra I
- CST Algebra II
- CST Biology
- CST Chemistry
- CST Earth Science
- CST English-Language Arts
- CST General Mathematics
- CST Geometry
- CST Integrated Math 1
- CST Integrated/Coordinated Science
- CST Physics
- CST Science
- CST Summative High School Math
- CST U.S. History
- CST World History
AYP Results (2010)
Overall AYP Met: Yes
ELA AYP Met: Yes
Math AYP Met: Yes
ACT Exam Results (2009)
Percent of Students Taking ACT Exam: 9.3%
Average Combined Score: 24.2
Percent Scoring At or Above 21: 77.6%
SAT Exam Results (2009)
Percent of Students Taking SAT Exam: 30.3%
Average Combined Score: 1,524.9
Critical Reading Average: 508.6
Math Average: 518.3
Writing Average: 498.0
Percent Scoring At or Above 1500: 52.5%
CST - Test Proficiency by Grade and Subject
Grade 9 - % of students at or above proficiency
| School | District | State | |
|---|---|---|---|
| CST Algebra I Test | |||
| 2010 | 28.0% | 17.0% | 22.0% |
| 2009 | 22.0% | 18.0% | 21.0% |
| 2008 | 23.0% | 13.0% | 18.0% |
| CST Biology Test | |||
| 2010 | 87.0% | 58.0% | 55.0% |
| 2009 | 74.0% | 51.0% | 51.0% |
| 2008 | 81.0% | 53.0% | 52.0% |
| CST Earth Science Test | |||
| 2010 | 50.0% | 36.0% | 35.0% |
| 2009 | 43.0% | 35.0% | 29.0% |
| 2008 | 30.0% | 30.0% | 31.0% |
| CST English-Language Arts Test | |||
| 2010 | 66.0% | 44.0% | 54.0% |
| 2009 | 56.0% | 41.0% | 50.0% |
| 2008 | 52.0% | 37.0% | 49.0% |
| CST Geometry Test | |||
| 2010 | 56.0% | 44.0% | 46.0% |
| 2009 | 59.0% | 46.0% | 47.0% |
| 2008 | 63.0% | 40.0% | 43.0% |
| CST World History Test | |||
| 2010 | 24.0% | 7.0% | 45.0% |
| 2009 | 6.0% | 7.0% | 41.0% |
| 2008 | 20.0% | 6.0% | 36.0% |
| CST General Mathematics Test | |||
| 2009 | 4.0% | 7.0% | 17.0% |
| 2008 | 2.0% | 8.0% | 18.0% |
Grade 10 - % of students at or above proficiency
| School | District | State | |
|---|---|---|---|
| CST Algebra I Test | |||
| 2010 | 13.0% | 6.0% | 12.0% |
| 2009 | 11.0% | 5.0% | 11.0% |
| 2008 | 7.0% | 4.0% | 9.0% |
| CST Algebra II Test | |||
| 2010 | 54.0% | 42.0% | 40.0% |
| 2009 | 62.0% | 41.0% | 37.0% |
| 2008 | 45.0% | 34.0% | 36.0% |
| CST Biology Test | |||
| 2010 | 64.0% | 40.0% | 38.0% |
| 2009 | 43.0% | 33.0% | 34.0% |
| 2008 | 44.0% | 28.0% | 35.0% |
| CST Chemistry Test | |||
| 2010 | 72.0% | 63.0% | 47.0% |
| 2009 | 54.0% | 62.0% | 44.0% |
| CST English-Language Arts Test | |||
| 2010 | 60.0% | 41.0% | 45.0% |
| 2009 | 53.0% | 38.0% | 44.0% |
| 2008 | 45.0% | 33.0% | 41.0% |
| CST Geometry Test | |||
| 2010 | 26.0% | 12.0% | 14.0% |
| 2009 | 19.0% | 11.0% | 14.0% |
| 2008 | 11.0% | 8.0% | 12.0% |
| CST Science Test | |||
| 2010 | 60.0% | 47.0% | 46.0% |
| 2009 | 56.0% | 43.0% | 44.0% |
| 2008 | 43.0% | 34.0% | 40.0% |
| CST World History Test | |||
| 2010 | 56.0% | 40.0% | 42.0% |
| 2009 | 50.0% | 33.0% | 38.0% |
| 2008 | 39.0% | 26.0% | 33.0% |
Grade 11 - % of students at or above proficiency
| School | District | State | |
|---|---|---|---|
| CST Algebra I Test | |||
| 2010 | 11.0% | 5.0% | 8.0% |
| 2009 | 5.0% | 4.0% | 8.0% |
| 2008 | 4.0% | 2.0% | 5.0% |
| CST Algebra II Test | |||
| 2010 | 31.0% | 13.0% | 14.0% |
| 2009 | 17.0% | 10.0% | 12.0% |
| 2008 | 13.0% | 8.0% | 11.0% |
| CST Biology Test | |||
| 2010 | 59.0% | 26.0% | 46.0% |
| CST Chemistry Test | |||
| 2010 | 51.0% | 25.0% | 30.0% |
| 2009 | 55.0% | 22.0% | 27.0% |
| 2008 | 44.0% | 18.0% | 25.0% |
| CST English-Language Arts Test | |||
| 2010 | 54.0% | 34.0% | 42.0% |
| 2009 | 44.0% | 30.0% | 40.0% |
| 2008 | 39.0% | 25.0% | 37.0% |
| CST Geometry Test | |||
| 2010 | 14.0% | 5.0% | 6.0% |
| 2009 | 3.0% | 3.0% | 7.0% |
| CST Integrated/Coordinated Science Test | |||
| 2010 | 24.0% | 9.0% | 8.0% |
| CST Physics Test | |||
| 2010 | 41.0% | 48.0% | 53.0% |
| 2009 | 8.0% | 39.0% | 50.0% |
| 2008 | 7.0% | 28.0% | 47.0% |
| CST Summative High School Math Test | |||
| 2010 | 66.0% | 43.0% | 50.0% |
| 2009 | 52.0% | 39.0% | 47.0% |
| 2008 | 50.0% | 32.0% | 43.0% |
| CST U.S. History Test | |||
| 2010 | 63.0% | 41.0% | 45.0% |
| 2009 | 46.0% | 35.0% | 44.0% |
| 2008 | 35.0% | 28.0% | 38.0% |
| CST Earth Science Test | |||
| 2009 | 23.0% | 14.0% | 26.0% |
| CST Integrated Math 1 Test | |||
| 2009 | 3.0% | 7.0% | 9.0% |
| 2008 | 7.0% | 5.0% | 9.0% |
End of Course - % of students at or above proficiency
| School | District | State | |
|---|---|---|---|
| CST Algebra I Test | |||
| 2010 | 21.0% | 12.0% | 31.0% |
| 2009 | 16.0% | 12.0% | 28.0% |
| 2008 | 16.0% | 9.0% | 25.0% |
| CST Algebra II Test | |||
| 2010 | 42.0% | 27.0% | 31.0% |
| 2009 | 41.0% | 25.0% | 28.0% |
| 2008 | 28.0% | 21.0% | 27.0% |
| CST Biology Test | |||
| 2010 | 69.0% | 43.0% | 46.0% |
| 2009 | 50.0% | 35.0% | 42.0% |
| 2008 | 51.0% | 31.0% | 42.0% |
| CST Chemistry Test | |||
| 2010 | 58.0% | 31.0% | 38.0% |
| 2009 | 54.0% | 29.0% | 36.0% |
| 2008 | 44.0% | 23.0% | 32.0% |
| CST Earth Science Test | |||
| 2010 | 50.0% | 32.0% | 33.0% |
| 2009 | 42.0% | 29.0% | 28.0% |
| 2008 | 30.0% | 24.0% | 28.0% |
| CST Geometry Test | |||
| 2010 | 34.0% | 20.0% | 27.0% |
| 2009 | 32.0% | 19.0% | 26.0% |
| 2008 | 30.0% | 16.0% | 24.0% |
| CST Integrated/Coordinated Science Test | |||
| 2010 | 24.0% | 16.0% | 16.0% |
| CST Physics Test | |||
| 2010 | 41.0% | 51.0% | 49.0% |
| 2009 | 8.0% | 41.0% | 46.0% |
| 2008 | 7.0% | 30.0% | 43.0% |
| CST Summative High School Math Test | |||
| 2010 | 67.0% | 43.0% | 54.0% |
| 2009 | 54.0% | 39.0% | 50.0% |
| 2008 | 50.0% | 33.0% | 47.0% |
| CST World History Test | |||
| 2010 | 54.0% | 37.0% | 41.0% |
| 2009 | 45.0% | 30.0% | 38.0% |
| 2008 | 38.0% | 24.0% | 33.0% |
| CST General Mathematics Test | |||
| 2009 | 4.0% | 7.0% | 26.0% |
| 2008 | 2.0% | 8.0% | 27.0% |
| CST Integrated Math 1 Test | |||
| 2009 | 3.0% | 7.0% | 11.0% |
| 2008 | 7.0% | 4.0% | 11.0% |
Source: CA Department of Education 2009-2010
School Map and Similar Schools Nearby
Click to Activate Map of Nearby School Campuses
Private
Public
This School
Similar Schools Nearby
| Fruitvale Junior High School 7-8 | 702 Students | 1.6 miles away | Not Yet Rated | |
| Liberty High School 9-12 | 1,856 Students | 3.0 miles away | Not Yet Rated | |
| Beardsley Junior High School 7-8 | 361 Students | 3.3 miles away | Not Yet Rated | |
| West High School 9-12 | 2,119 Students | 4.4 miles away | ![]() 5 out of 5 | |
| North High School 9-12 | 2,195 Students | 4.5 miles away | ![]() 2.5 out of 5 | |
| Bakersfield High School 9-12 | 2,746 Students | 4.8 miles away | Not Yet Rated | |
| O. J. Actis Junior High School 7-8 | 714 Students | 5.0 miles away | ![]() 5 out of 5 | |
| Stockdale High School 9-12 | 2,192 Students | 5.2 miles away | Not Yet Rated | |
| Tevis Junior High School 7-8 | 729 Students | 5.5 miles away | ![]() 5 out of 5 | |
| Fred L. Thompson Junior High School 7-8 | 843 Students | 5.9 miles away | ![]() 1 out of 5 | |
Compare This School To Nearby Schools ->
School Community Forum

Join a discussion about Centennial High School and talk to others in the community including students, parents, teachers, and administrators.
Popular Discussion Topics
- Admissions and Registration Questions (e.g. Dress Code and Discipline Policy)
- School Calendar and Upcoming Events (e.g. Graduation)
- After School Programs, Extracurricular Activities, and Athletics (e.g. Football)
- News and Announcements (e.g. Yearbook and Class Supply List Details)
- Graduate and Alumni Events (e.g. Organizing Class Reunions)
Navigation
Can't Find What You Are Looking For?
Rankings
Nearby Cities
Sponsored Links
K-12 Articles
Everyone Loves Going to the Doctor and Dentist
Going to the doctor or dentist can be traumatic for children of all ages. Many adults do not...
It's the Most Wonderful Time of the Year!
For most of the country, school is starting up this week or later this month-at the beginning of...
Teaching Your Kids About Respect, Values and Violence
These days it seems that every newscast reports at least once incident of violence. As parents, we...


