Prairie Valley High School
Rating
Not Available
Not Available

5 out of 5 | 2 Reviews
Find Old Friends From Prairie Valley High School
Use the form below to search for alumni from Prairie Valley High School.
School Description
School Summary and Highlights
- Enrolls 73 middle and high school students from grades 6-12
- Ranks 92nd out of 1,325 high schools in TX.
- 2010 Overall School AYP Met Status: Yes
Additional Contact Information
- Mailing Address: Rt 3 Box 550, Nocona, TX 76255
- Principal or Admin: Tim West
- Fax: (940) 825-4650
- Website: www2.esc9.net
School Operational Details
- Title I EligibleAll students of this school are eligible for participation in authorized programs.
School District Details
- Prairie Valley Independent School District (ISD)
- Per-Pupil Spending: $11,492
- Graduation Rate: 100.0%
- Students Per Teacher: 8.8
- Enrolled Students: 156
Faculty Details and Student Enrollment
Students and Faculty
- Total Students Enrolled: 73
- Total Full Time "Equivalent" Teachers: 9.9
- Average Student-To-Teacher Ratio: 7.4
Students Gender Breakdown
- Males: 32 (43.8%)
- Females: 41 (56.2%)
Free Lunch Student Eligibility Breakdown
- Eligible for Reduced Lunch: 19 (26.0%)
- Eligible for Free Lunch: 18 (24.7%)
- Eligible for Either Reduced or Free Lunch: 37 (50.7%)
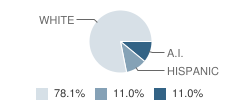
Student Enrollment Distribution by Race / Ethnicity
| Number | Percent | |
|---|---|---|
| American Indian | 8 | 11.0% |
| Black | - | - |
| Asian | - | - |
| Hispanic | 8 | 11.0% |
| White | 57 | 78.1% |
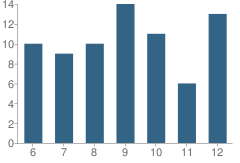
Number of Students Per Grade
| Number | Percent | |
|---|---|---|
| 6th Grade | 10 | 13.7% |
| 7th Grade | 9 | 12.3% |
| 8th Grade | 10 | 13.7% |
| 9th Grade | 14 | 19.2% |
| 10th Grade | 11 | 15.1% |
| 11th Grade | 6 | 8.2% |
| 12th Grade | 13 | 17.8% |
Faculty Breakdown (2010)
Average Teacher Experience
School:
15.8
District:
13.4
State:
11.3
Percent of Teachers With 1-5 Years Experience
School:
1.2%
District:
22.7%
State:
31.0%
Percent of Teachers With 6-10 Years Experience
School:
10.1%
District:
5.7%
State:
20.3%
Percent of Teachers With 11-20 Years Experience
School:
40.8%
District:
34.0%
State:
24.4%
Percent of Teachers With Greater Than 20 Years Experience
School:
46.7%
District:
32.0%
State:
18.3%
Faculty Salary (2010)
School Administration Average Base Salary
School:
$65,771
District:
$65,771
State:
$70,209
Teacher Average Base Salary
School:
$46,680
District:
$42,101
State:
$48,263
Beginning Teacher Average Base Salary
School:
$15,460
District:
$15,460
State:
$41,165
Teacher With 1-5 Years Experience Average Base Salary
School:
$32,120
State:
$43,527
Teacher With 6-10 Years Experience Average Base Salary
School:
$34,600
State:
$46,149
Teacher With 11-20 Years Experience Average Base Salary
School:
$44,182
State:
$50,153
Teacher With Greater Than 20 Years Experience Average Base Salary
School:
$52,645
State:
$58,427
Source: TX Department of Education, Source: NCES 2009-2010
School Ratings and Reviews
Overall Rating: 5

5 out of 5 | 2 Reviews
The Overall Rating is the school's average rating from parents, students, school faculty and staff. The highest rating is five apples and the lowest is one apple.
Share Your Review About This School
2 reviews for Prairie Valley High School
- Reviewed by Former Student on July 07, 2009
- Rating:
 (5 / 5) Flag as inappropriate
 - went to school there & loved it
- Reviewed by Community Member on April 03, 2009
- Rating: (5 / 5) Flag as inappropriate
- Great hometown feel. Super academics.
School Map and Similar Schools Nearby
Click to Activate Map of Nearby School Campuses
Private
Public
This School
Similar Schools Nearby
| Nocona High School 9-12 | 227 Students | 12.2 miles away | Not Yet Rated | |
| Saint Jo High School 7-12 | 130 Students | 18.4 miles away |  5 out of 5 | |
| Muenster High School 7-12 | 233 Students | 24.3 miles away | 5 out of 5 | |
| Gold Burg High School 6-12 | 80 Students | 25.1 miles away | Not Yet Rated | |
| Forestburg School PK-12 | 204 Students | 28.8 miles away | Not Yet Rated | |
| Bowie High School 9-12 | 433 Students | 29.5 miles away | Not Yet Rated | |
| Bowie Junior High School 6-8 | 319 Students | 29.9 miles away | Not Yet Rated | |
Compare This School To Nearby Schools ->
Navigation
Can't Find What You Are Looking For?
Nearby Cities
Sponsored Links
K-12 Articles

Teaching Children Respect
Statistics prove that there are many different family types in today’s society. Grandparents or a...
Statistics prove that there are many different family types in today’s society. Grandparents or a...

Cell Phones... the Best Thing Since Sliced Bread or the Worst Invention in the World?
Cell phones are wonderful, the best things humans have ever invented! They help us keep in touch...
Cell phones are wonderful, the best things humans have ever invented! They help us keep in touch...

Hurt: A Book Report
My last book report was over 15 years ago, and I’m a bit rusty, but here goes (Don’t forget: book...
My last book report was over 15 years ago, and I’m a bit rusty, but here goes (Don’t forget: book...