Merriman Park Elementary School
Rating
Not Available
Not Available

5 out of 5 | 1 Review
Find Old Friends From Merriman Park Elementary School
Use the form below to search for alumni from Merriman Park Elementary School.
School Description
School Summary and Highlights
- Enrolls 419 elementary school students from grades KG-6
- Ranks 784th out of 4,319 elementary schools in TX.
- 2010 Overall School AYP Met Status: Yes
Additional Contact Information
- Principal or Admin: Larry Labue
- Fax: (469) 593-2751
- Website: www.richardson.k12.tx.us
School Operational Details
- Title I EligibleAll students of this school are eligible for participation in authorized programs.
School District Details
- Richardson Independent School District (ISD)
- Per-Pupil Spending: $8,106
- Graduation Rate: 71.3%
- Dropout Rate: 2.5%
- Students Per Teacher: 14.0
- Enrolled Students: 34,843
Faculty Details and Student Enrollment
Students and Faculty
- Total Students Enrolled: 419
- Total Full Time "Equivalent" Teachers: 30.0
- Average Student-To-Teacher Ratio: 14.0
Students Gender Breakdown
- Males: 205 (48.9%)
- Females: 214 (51.1%)
Free Lunch Student Eligibility Breakdown
- Eligible for Reduced Lunch: 12 (2.9%)
- Eligible for Free Lunch: 228 (54.4%)
- Eligible for Either Reduced or Free Lunch: 240 (57.3%)
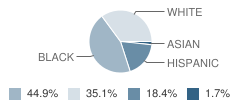
Student Enrollment Distribution by Race / Ethnicity
| Number | Percent | |
|---|---|---|
| American Indian | - | - |
| Black | 188 | 44.9% |
| Asian | 7 | 1.7% |
| Hispanic | 77 | 18.4% |
| White | 147 | 35.1% |
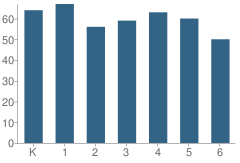
Number of Students Per Grade
| Number | Percent | |
|---|---|---|
| Kindergarten | 64 | 15.3% |
| 1st Grade | 67 | 16.0% |
| 2nd Grade | 56 | 13.4% |
| 3rd Grade | 59 | 14.1% |
| 4th Grade | 63 | 15.0% |
| 5th Grade | 60 | 14.3% |
| 6th Grade | 50 | 11.9% |
Faculty Breakdown (2010)
Average Teacher Experience
School:
6.8
District:
9.8
State:
11.3
Percent of Teachers With 1-5 Years Experience
School:
55.8%
District:
40.7%
State:
31.0%
Percent of Teachers With 6-10 Years Experience
School:
13.4%
District:
18.0%
State:
20.3%
Percent of Teachers With 11-20 Years Experience
School:
16.7%
District:
19.5%
State:
24.4%
Percent of Teachers With Greater Than 20 Years Experience
School:
10.0%
District:
15.2%
State:
18.3%
Faculty Salary (2010)
School Administration Average Base Salary
School:
$78,127
District:
$76,172
State:
$70,209
Teacher Average Base Salary
School:
$47,060
District:
$48,557
State:
$48,263
Beginning Teacher Average Base Salary
School:
$38,665
District:
$44,528
State:
$41,165
Teacher With 1-5 Years Experience Average Base Salary
School:
$45,925
State:
$43,527
Teacher With 6-10 Years Experience Average Base Salary
School:
$47,288
State:
$46,149
Teacher With 11-20 Years Experience Average Base Salary
School:
$49,564
State:
$50,153
Teacher With Greater Than 20 Years Experience Average Base Salary
School:
$52,385
State:
$58,427
Source: TX Department of Education, Source: NCES 2009-2010
School Ratings and Reviews
Overall Rating: 5

5 out of 5 | 1 Review
The Overall Rating is the school's average rating from parents, students, school faculty and staff. The highest rating is five apples and the lowest is one apple.
Share Your Review About This School
1 review for Merriman Park Elementary School
- Reviewed by Parent/Guardian on August 18, 2009
- Rating:
 (5 / 5) Flag as inappropriate
 - Information Merriman Park Elementary School uniforms
School Map and Similar Schools Nearby
Click to Activate Map of Nearby School Campuses
Private
Public
This School
Similar Schools Nearby
| Jill Stone Elementary School at Vickery Meadow PK-5 | 314 Students | 1.0 miles away | Not Yet Rated | |
| White Rock Elementary School PK-6 | 539 Students | 1.0 miles away | Not Yet Rated | |
| Jack Lowe Sr Elementary School PK-5 | 694 Students | 1.2 miles away | Not Yet Rated | |
| Moss Haven Elementary School KG-6 | 386 Students | 1.2 miles away | Not Yet Rated | |
| Northlake Elementary School PK-6 | 570 Students | 1.3 miles away |  5 out of 5 | |
| Lee Mcshan Jr Elementary School PK-5 | 589 Students | 1.3 miles away | Not Yet Rated | |
| L L Hotchkiss Elementary School PK-5 | 937 Students | 1.4 miles away | 5 out of 5 | |
| Skyview Elementary School PK-6 | 583 Students | 1.8 miles away | Not Yet Rated | |
| Lake Highlands Elementary School PK-6 | 590 Students | 1.9 miles away |  1 out of 5 | |
| Dan D Rogers Elementary School PK-5 | 446 Students | 1.9 miles away | Not Yet Rated | |
Compare This School To Nearby Schools ->
School Community Forum

Join a discussion about Merriman Park Elementary School and talk to others in the community including students, parents, teachers, and administrators.
Popular Discussion Topics
- Admissions and Registration Questions (e.g. Dress Code and Discipline Policy)
- School Calendar and Upcoming Events (e.g. Graduation)
- After School Programs, Extracurricular Activities, and Athletics (e.g. Football)
- News and Announcements (e.g. Yearbook and Class Supply List Details)
- Graduate and Alumni Events (e.g. Organizing Class Reunions)
Navigation
Can't Find What You Are Looking For?
Nearby Cities
Sponsored Links
K-12 Articles

Help Your Child Achieve Success in Middle School
Middle school is for children between the ages of 10 and 14 years. At this time children begin to...
Middle school is for children between the ages of 10 and 14 years. At this time children begin to...

The Very Best Things in the World
A recent poll in the U.K. revealed that children view the “very best thing in the world” as being...
A recent poll in the U.K. revealed that children view the “very best thing in the world” as being...

Hurt: A Book Report
My last book report was over 15 years ago, and I’m a bit rusty, but here goes (Don’t forget: book...
My last book report was over 15 years ago, and I’m a bit rusty, but here goes (Don’t forget: book...