Alternative Learn Center School
Rating
Not Available
Not Available

No Reviews Yet
Find Old Friends From Alternative Learn Center School
Use the form below to search for alumni from Alternative Learn Center School.
School Description
School Summary and Highlights
- Enrolls 39 high school students from grades 9-12
- 2010 Overall School AYP Met Status: Yes
Additional Contact Information
- Principal or Admin: Mr Charles Perez
- Fax: (361) 387-3849
- Website: www.robstownisd.esc2.net
School Operational Details
- Alternative School
- Title I EligibleAll students of this school are eligible for participation in authorized programs.
School District Details
- Robstown Independent School District (ISD)
- Per-Pupil Spending: $9,277
- Graduation Rate: 57.8%
- Dropout Rate: 11.6%
- Students Per Teacher: 13.9
- Enrolled Students: 3,390
Faculty Details and Student Enrollment
Students and Faculty
- Total Students Enrolled: 39
- Total Full Time "Equivalent" Teachers: 4.4
- Average Student-To-Teacher Ratio: 8.9
Students Gender Breakdown
- Males: 15 (38.5%)
- Females: 24 (61.5%)
Free Lunch Student Eligibility Breakdown
- Eligible for Reduced Lunch: 2 (5.1%)
- Eligible for Free Lunch: 17 (43.6%)
- Eligible for Either Reduced or Free Lunch: 19 (48.7%)
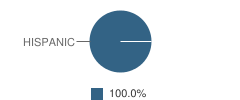
Student Enrollment Distribution by Race / Ethnicity
| Number | Percent | |
|---|---|---|
| American Indian | - | - |
| Black | - | - |
| Asian | - | - |
| Hispanic | 39 | 100.0% |
| White | - | - |
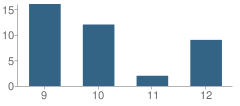
Number of Students Per Grade
| Number | Percent | |
|---|---|---|
| 9th Grade | 16 | 41.0% |
| 10th Grade | 12 | 30.8% |
| 11th Grade | 2 | 5.1% |
| 12th Grade | 9 | 23.1% |
Graduation & Dropout Rates (2009)
Graduation Rate
School:
4.5%
District:
66.3%
State:
80.6%
Dropout Rate
School:
13.6%
District:
14.1%
State:
9.4%
Faculty Breakdown (2010)
Average Teacher Experience
School:
10.0
District:
15.2
State:
11.3
Percent of Teachers With 1-5 Years Experience
School:
26.2%
District:
24.6%
State:
31.0%
Percent of Teachers With 6-10 Years Experience
School:
14.2%
District:
12.3%
State:
20.3%
Percent of Teachers With 11-20 Years Experience
School:
3.2%
District:
26.4%
State:
24.4%
Percent of Teachers With Greater Than 20 Years Experience
School:
36.2%
District:
31.6%
State:
18.3%
Faculty Salary (2010)
Teacher Average Base Salary
School:
$40,268
District:
$43,354
State:
$48,263
Beginning Teacher Average Base Salary
School:
$28,424
District:
$32,117
State:
$41,165
Teacher With 1-5 Years Experience Average Base Salary
School:
$34,372
State:
$43,527
Teacher With 6-10 Years Experience Average Base Salary
School:
$39,302
State:
$46,149
Teacher With 11-20 Years Experience Average Base Salary
School:
$44,894
State:
$50,153
Teacher With Greater Than 20 Years Experience Average Base Salary
School:
$51,134
State:
$58,427
Source: TX Department of Education, Source: NCES 2009-2010
School Ratings and Reviews
Be The First To Review Alternative Learn Center School!
School Map and Similar Schools Nearby
Click to Activate Map of Nearby School Campuses
Private
Public
This School
Similar Schools Nearby
| Nueces County Juvenile Justice Alternative Education Program (Jjaep) School 9 | 1 Students | 4.8 miles away | Not Yet Rated | - |
| Nueces County Juvenile Justice Alternative Education Program (Jjaep) School 8-11 | 2 Students | 7.7 miles away | Not Yet Rated | - |
| Tuloso-Midway Academic Career Center School 9-12 | 28 Students | 10.2 miles away | Not Yet Rated | |
| Student Learning and Guidance Center School 5-12 | 175 Students | 16.2 miles away | Not Yet Rated | - |
| Alternative High School Center 7-12 | 221 Students | 16.9 miles away | Not Yet Rated | |
| Nueces County Juvenile Justice Alternative Education Program (Jjaep) School 8-10 | 7 Students | 17.0 miles away | Not Yet Rated | - |
| Juvenile Detention Center School 8-11 | 6 Students | 18.7 miles away | Not Yet Rated | - |
Compare This School To Nearby Schools ->
Navigation
Can't Find What You Are Looking For?
Nearby Cities
Sponsored Links
K-12 Articles

Teaching Your Kids About Respect, Values and Violence
These days it seems that every newscast reports at least once incident of violence. As parents, we...
These days it seems that every newscast reports at least once incident of violence. As parents, we...

Kids and Competition
In the backyard, the classroom, the community and while participating in sports and other...
In the backyard, the classroom, the community and while participating in sports and other...

Bullycide: What is It and How Can It Be Prevented?
Disclaimer: This article expresses my opinion that has been formed by personal experience and...
Disclaimer: This article expresses my opinion that has been formed by personal experience and...