Lee Middle School
Rating
Not Available
Not Available

5 out of 5 | 2 Reviews
Find Old Friends From Lee Middle School
Use the form below to search for alumni from Lee Middle School.
School Description
School Summary and Highlights
- Enrolls 905 middle school students from grades 6-8
- Ranks 1066th out of 1,763 middle schools in TX.
- 2010 Overall School AYP Met Status: Yes
Additional Contact Information
- Principal or Admin: Mr Jd Koehn
- Fax: (325) 947-3890
- Website: www.saisd.org
School Operational Details
- Title I EligibleAll students of this school are eligible for participation in authorized programs.
School District Details
- San Angelo Independent School District (ISD)
- Per-Pupil Spending: $7,480
- Graduation Rate: 73.8%
- Dropout Rate: 5.4%
- Students Per Teacher: 14.5
- Enrolled Students: 14,492
Faculty Details and Student Enrollment
Students and Faculty
- Total Students Enrolled: 905
- Total Full Time "Equivalent" Teachers: 73.4
- Average Student-To-Teacher Ratio: 12.3
Students Gender Breakdown
- Males: 468 (51.7%)
- Females: 437 (48.3%)
Free Lunch Student Eligibility Breakdown
- Eligible for Reduced Lunch: 118 (13.0%)
- Eligible for Free Lunch: 412 (45.5%)
- Eligible for Either Reduced or Free Lunch: 530 (58.6%)
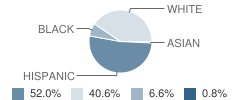
Student Enrollment Distribution by Race / Ethnicity
| Number | Percent | |
|---|---|---|
| American Indian | - | - |
| Black | 60 | 6.6% |
| Asian | 7 | 0.8% |
| Hispanic | 471 | 52.0% |
| White | 367 | 40.6% |
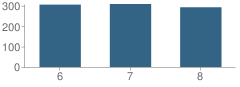
Number of Students Per Grade
| Number | Percent | |
|---|---|---|
| 6th Grade | 305 | 33.7% |
| 7th Grade | 308 | 34.0% |
| 8th Grade | 292 | 32.3% |
Faculty Breakdown (2010)
Average Teacher Experience
School:
10.6
District:
11.7
State:
11.3
Percent of Teachers With 1-5 Years Experience
School:
23.2%
District:
27.1%
State:
31.0%
Percent of Teachers With 6-10 Years Experience
School:
24.5%
District:
18.3%
State:
20.3%
Percent of Teachers With 11-20 Years Experience
School:
30.0%
District:
28.7%
State:
24.4%
Percent of Teachers With Greater Than 20 Years Experience
School:
12.8%
District:
18.8%
State:
18.3%
Faculty Salary (2010)
School Administration Average Base Salary
School:
$61,230
District:
$65,299
State:
$70,209
Teacher Average Base Salary
School:
$42,628
District:
$43,571
State:
$48,263
Beginning Teacher Average Base Salary
School:
$37,071
District:
$36,464
State:
$41,165
Teacher With 1-5 Years Experience Average Base Salary
School:
$38,104
State:
$43,527
Teacher With 6-10 Years Experience Average Base Salary
School:
$40,743
State:
$46,149
Teacher With 11-20 Years Experience Average Base Salary
School:
$45,014
State:
$50,153
Teacher With Greater Than 20 Years Experience Average Base Salary
School:
$52,976
State:
$58,427
Source: TX Department of Education, Source: NCES 2009-2010
School Ratings and Reviews
Overall Rating: 5

5 out of 5 | 2 Reviews
The Overall Rating is the school's average rating from parents, students, school faculty and staff. The highest rating is five apples and the lowest is one apple.
Share Your Review About This School
2 reviews for Lee Middle School
- Reviewed by Former Student on July 27, 2008
- Rating:
 (5 / 5) Flag as inappropriate
 - I love this school! i hope everybody loves it as much as i do! the teachers are great and so are the other students!
- Reviewed by Former Student on July 26, 2007
- Rating: (5 / 5) Flag as inappropriate
- i loved the teachers here..
well s'ome of them. but over all its an awesome school (building)
School Map and Similar Schools Nearby
Click to Activate Map of Nearby School Campuses
Private
Public
This School
Similar Schools Nearby
| Glenn Middle School 6-8 | 1,144 Students | 1.3 miles away | Not Yet Rated | |
| Day Head Start School PK-9 | 201 Students | 3.2 miles away | Not Yet Rated | - |
| Lincoln Middle School 6-8 | 888 Students | 4.4 miles away | Not Yet Rated | |
| Grape Creek Middle School 6-8 | 225 Students | 8.8 miles away | Not Yet Rated | |
| Wall Middle School 6-8 | 252 Students | 11.0 miles away | Not Yet Rated | |
| Christoval High School 6-12 | 248 Students | 18.8 miles away | Not Yet Rated | |
| Miles Elementary School PK-6 | 219 Students | 20.0 miles away | Not Yet Rated | |
| Water Valley Elementary School PK-6 | 179 Students | 20.9 miles away | Not Yet Rated | |
| Water Valley High School 7-12 | 145 Students | 21.0 miles away | Not Yet Rated | |
| Irion Elementary School KG-6 | 154 Students | 24.6 miles away | Not Yet Rated | |
Compare This School To Nearby Schools ->
School Community Forum

Join a discussion about Lee Middle School and talk to others in the community including students, parents, teachers, and administrators.
Popular Discussion Topics
- Admissions and Registration Questions (e.g. Dress Code and Discipline Policy)
- School Calendar and Upcoming Events (e.g. Graduation)
- After School Programs, Extracurricular Activities, and Athletics (e.g. Football)
- News and Announcements (e.g. Yearbook and Class Supply List Details)
- Graduate and Alumni Events (e.g. Organizing Class Reunions)
Navigation
Can't Find What You Are Looking For?
Nearby Cities
Sponsored Links
K-12 Articles

Public or Private?
Daniel attended private school until sixth grade, when he was diagnosed with Asperger's Syndrome, a...
Daniel attended private school until sixth grade, when he was diagnosed with Asperger's Syndrome, a...

Educators and Childhood Obesity
Obesity in childhood is rising to epidemic proportions in America and educators should be...
Obesity in childhood is rising to epidemic proportions in America and educators should be...

Keep Morning Stress at a Minimum: Establish a Routine
Morning! It can be a time of stress. The kids are fighting over who gets to use the bathroom first,...
Morning! It can be a time of stress. The kids are fighting over who gets to use the bathroom first,...