Juvenile Detention Center School
Rating
Not Available
Not Available

1 out of 5 | 1 Review
Find Old Friends From Juvenile Detention Center School
Use the form below to search for alumni from Juvenile Detention Center School.
School Description
School Summary and Highlights
- Enrolls 160 middle and high school students from grades 6-12
- 2010 Overall School AYP Met Status: Yes
Additional Contact Information
- Principal or Admin: John Simpson
- Fax: (210) 531-1099
- Website: www.saisd.net
School Operational Details
- Alternative School
School District Details
- San Antonio Independent School District (ISD)
- Per-Pupil Spending: $8,644
- Graduation Rate: 51.5%
- Dropout Rate: 10.9%
- Students Per Teacher: 16.4
- Enrolled Students: 55,327
Faculty Details and Student Enrollment
Students and Faculty
- Total Students Enrolled: 160
- Total Full Time "Equivalent" Teachers: 14.0
- Average Student-To-Teacher Ratio: 11.4
Students Gender Breakdown
- Males: 129 (80.6%)
- Females: 31 (19.4%)
Free Lunch Student Eligibility Breakdown
- Eligible for Reduced Lunch: 2 (1.3%)
- Eligible for Free Lunch: 18 (11.3%)
- Eligible for Either Reduced or Free Lunch: 20 (12.5%)
Student Enrollment Distribution by Race / Ethnicity
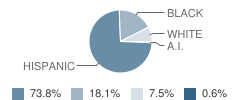
| Number | Percent | |
|---|---|---|
| American Indian | 1 | 0.6% |
| Black | 29 | 18.1% |
| Asian | - | - |
| Hispanic | 118 | 73.8% |
| White | 12 | 7.5% |
Number of Students Per Grade
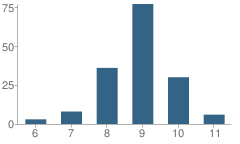
| Number | Percent | |
|---|---|---|
| 6th Grade | 3 | 1.9% |
| 7th Grade | 8 | 5.0% |
| 8th Grade | 36 | 22.5% |
| 9th Grade | 77 | 48.1% |
| 10th Grade | 30 | 18.8% |
| 11th Grade | 6 | 3.8% |
Graduation & Dropout Rates (2009)
Dropout Rate
School:
84.2%
District:
21.0%
State:
9.4%
Faculty Breakdown (2010)
Average Teacher Experience
School:
12.9
District:
12.6
State:
11.3
Percent of Teachers With 1-5 Years Experience
School:
21.4%
District:
26.7%
State:
31.0%
Percent of Teachers With 6-10 Years Experience
School:
7.1%
District:
17.7%
State:
20.3%
Percent of Teachers With 11-20 Years Experience
School:
35.7%
District:
22.2%
State:
24.4%
Percent of Teachers With Greater Than 20 Years Experience
School:
21.4%
District:
24.9%
State:
18.3%
Faculty Salary (2010)
Teacher Average Base Salary
School:
$49,640
District:
$50,045
State:
$48,263
Beginning Teacher Average Base Salary
School:
$43,275
District:
$43,170
State:
$41,165
Teacher With 1-5 Years Experience Average Base Salary
School:
$45,091
State:
$43,527
Teacher With 6-10 Years Experience Average Base Salary
School:
$46,225
State:
$46,149
Teacher With 11-20 Years Experience Average Base Salary
School:
$49,578
State:
$50,153
Teacher With Greater Than 20 Years Experience Average Base Salary
School:
$59,673
State:
$58,427
Source: TX Department of Education, Source: NCES 2009-2010
School Ratings and Reviews
Overall Rating: 1

1 out of 5 | 1 Review
The Overall Rating is the school's average rating from parents, students, school faculty and staff. The highest rating is five apples and the lowest is one apple.
Share Your Review About This School
1 review for Juvenile Detention Center School
- Reviewed by Teacher on January 09, 2010
- Rating:
 (1 / 5) Flag as inappropriate
 - Substitute Teacher Support could really improve ALOT with this campus! Also, the kids need to have more responsibilities for their actions! THE WORLD IS NOT GOING TO ALWAYS BE ON THEIR SIDE, AND SAY POOR LITTLE SUE OR POOR LITTLE JANE! The staff need to stop playing two against the middle with these kids! Letting them get away with some things sometimes and not letting them get away with things the rest of the time! There need to be more consistency on the campus! SAISD IS SETTING THOSE KIDS UP FOR FAILURE!
School Map and Similar Schools Nearby
Click to Activate Map of Nearby School Campuses
Private
Public
This School
Similar Schools Nearby
| Navarro Academy 9-12 | 155 Students | 1.9 miles away | Not Yet Rated | |
| Christus Santa Rosa School 2-10 | 7 Students | 2.4 miles away | Not Yet Rated | - |
| Healy-Murphy School 9-12 | 155 Students | 2.5 miles away | Not Yet Rated | |
| Cooper Academy 9-12 | 182 Students | 2.5 miles away | Not Yet Rated | |
| Pickett Center School 7-12 | 34 Students | 2.6 miles away | Not Yet Rated | |
| Bexar County Juvenile Justice Alternative Education Program (Jjaep) School 7-11 | 11 Students | 3.1 miles away | Not Yet Rated | - |
| Seidel Learning Center School 6-12 | 18 Students | 3.1 miles away | Not Yet Rated | |
| Jja School 8-12 | 5 Students | 3.2 miles away | Not Yet Rated | - |
| North East Juvenile Justice Alternative Education Program (Jjaep) School 7-12 | 17 Students | 3.2 miles away | Not Yet Rated | - |
| Fenley Transitional High School 9-10 | 5 Students | 3.3 miles away | Not Yet Rated | - |
Compare This School To Nearby Schools ->
School Community Forum

Join a discussion about Juvenile Detention Center School and talk to others in the community including students, parents, teachers, and administrators.
Popular Discussion Topics
- Admissions and Registration Questions (e.g. Dress Code and Discipline Policy)
- School Calendar and Upcoming Events (e.g. Graduation)
- After School Programs, Extracurricular Activities, and Athletics (e.g. Football)
- News and Announcements (e.g. Yearbook and Class Supply List Details)
- Graduate and Alumni Events (e.g. Organizing Class Reunions)
Navigation
Can't Find What You Are Looking For?
Sponsored Links
K-12 Articles

The Most Used Form of Communication
Writing has, quite surprisingly, become more and more important in today’s electronic society....
Writing has, quite surprisingly, become more and more important in today’s electronic society....

Adolescents, Sleep and Learning
Recently, adolescent’s sleep habits have been in the news. Research has shown that adolescents need...
Recently, adolescent’s sleep habits have been in the news. Research has shown that adolescents need...

Assisting Students to Overcome Test Anxiety
Every human copes with anxiety at one time or another. It is a basic emotion that we feel when...
Every human copes with anxiety at one time or another. It is a basic emotion that we feel when...