Hoopa Valley High School

5 out of 5 | 1 Review
Find Old Friends From Hoopa Valley High School
Use the form below to search for alumni from Hoopa Valley High School.
School Description
School Summary and Highlights
- Enrolls 253 high school students from grades 9-12
- Ranks 860th out of 1,197 high schools in CA.
- 2010 Overall School AYP Met Status: Yes
Additional Contact Information
- Mailing Address: PO Box 1308, Hoopa, CA 95546
School Operational Details
- Title I EligibleAll students of this school are eligible for participation in authorized programs.
School District Details
- Klamath-Trinity Joint Unified School District
- Per-Pupil Spending: $12,617
- Graduation Rate: 79.5%
- Dropout Rate: 6.5%
- Students Per Teacher: 15.0
- Enrolled Students: 1,018
Faculty Details and Student Enrollment
Students and Faculty
- Total Students Enrolled: 253
- Total Full Time "Equivalent" Teachers: 16.3
- Average Student-To-Teacher Ratio: 15.5
Students Gender Breakdown
- Males: 139 (54.9%)
- Females: 114 (45.1%)
Free Lunch Student Eligibility Breakdown
- Eligible for Reduced Lunch: 21 (8.3%)
- Eligible for Free Lunch: 122 (48.2%)
- Eligible for Either Reduced or Free Lunch: 143 (56.5%)
Student Enrollment Distribution by Race / Ethnicity
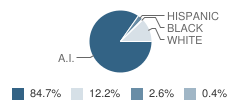
| Number | Percent | |
|---|---|---|
| American Indian | 194 | 76.7% |
| Black | 1 | 0.4% |
| Asian | - | - |
| Hispanic | 6 | 2.4% |
| White | 28 | 11.1% |
Number of Students Per Grade
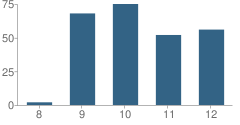
| Number | Percent | |
|---|---|---|
| 8th Grade | 2 | 0.8% |
| 9th Grade | 68 | 26.9% |
| 10th Grade | 75 | 29.6% |
| 11th Grade | 52 | 20.6% |
| 12th Grade | 56 | 22.1% |
Teacher Education Background (2009)
Percent With Bachelor's Degree: 10.5%
Teacher Credentials & Experience (2009)
Percent of Teachers With Credentials: 100.0%
Number of Certificated Staff: 19.0
Average Number of Years of Teacher Experience: 13.1
Average Age
School:
44.5
District:
56.0
Source: CA Department of Education, Source: NCES 2009-2010
Sponsored Links
Test Scores and Performance Information
Overall School Rating
How is this determined?
The overall school rating shows that Hoopa Valley High School performed on average worse than many other schools across the state on CST state exams in the following subjects:
- CST Algebra I
- CST Algebra II
- CST Biology
- CST Chemistry
- CST Earth Science
- CST English-Language Arts
- CST General Mathematics
- CST Geometry
- CST Science
- CST U.S. History
- CST World History
AYP Results (2010)
Overall AYP Met: Yes
ELA AYP Met: Yes
Math AYP Met: Yes
SAT Exam Results (2009)
Percent of Students Taking SAT Exam: 51.4%
Average Combined Score: 1,267.9
Critical Reading Average: 422.1
Math Average: 420.5
Writing Average: 425.3
Percent Scoring At or Above 1500: 10.5%
CST - Test Proficiency by Grade and Subject
Grade 9 - % of students at or above proficiency
| School | District | State | |
|---|---|---|---|
| CST Algebra I Test | |||
| 2010 | 5.0% | 5.0% | 22.0% |
| 2009 | 4.0% | 4.0% | 21.0% |
| 2008 | 12.0% | 12.0% | 18.0% |
| CST Earth Science Test | |||
| 2010 | 38.0% | 37.0% | 35.0% |
| CST English-Language Arts Test | |||
| 2010 | 33.0% | 30.0% | 54.0% |
| 2009 | 40.0% | 38.0% | 50.0% |
| 2008 | 30.0% | 29.0% | 49.0% |
| CST General Mathematics Test | |||
| 2010 | 23.0% | 19.0% | 17.0% |
| 2009 | 9.0% | 11.0% | 17.0% |
| 2008 | 11.0% | 10.0% | 18.0% |
| CST Geometry Test | |||
| 2010 | 31.0% | 31.0% | 46.0% |
| 2009 | 36.0% | 36.0% | 47.0% |
| CST Biology Test | |||
| 2009 | 71.0% | 71.0% | 51.0% |
Grade 10 - % of students at or above proficiency
| School | District | State | |
|---|---|---|---|
| CST Algebra II Test | |||
| 2010 | 9.0% | 9.0% | 40.0% |
| CST Biology Test | |||
| 2010 | 28.0% | 29.0% | 38.0% |
| 2009 | 17.0% | 17.0% | 34.0% |
| 2008 | 35.0% | 35.0% | 35.0% |
| CST English-Language Arts Test | |||
| 2010 | 37.0% | 33.0% | 45.0% |
| 2009 | 24.0% | 21.0% | 44.0% |
| 2008 | 25.0% | 21.0% | 41.0% |
| CST Geometry Test | |||
| 2010 | 21.0% | 21.0% | 14.0% |
| 2009 | 23.0% | 23.0% | 14.0% |
| 2008 | 6.0% | 6.0% | 12.0% |
| CST Science Test | |||
| 2010 | 39.0% | 35.0% | 46.0% |
| 2009 | 36.0% | 30.0% | 44.0% |
| 2008 | 26.0% | 26.0% | 40.0% |
| CST World History Test | |||
| 2010 | 24.0% | 21.0% | 42.0% |
| 2009 | 29.0% | 25.0% | 38.0% |
| 2008 | 14.0% | 14.0% | 33.0% |
| CST Algebra I Test | |||
| 2008 | 7.0% | 7.0% | 9.0% |
Grade 11 - % of students at or above proficiency
| School | District | State | |
|---|---|---|---|
| CST Algebra I Test | |||
| 2010 | 7.0% | 5.0% | 8.0% |
| CST Algebra II Test | |||
| 2010 | 8.0% | 8.0% | 14.0% |
| 2009 | 8.0% | 8.0% | 12.0% |
| 2008 | 6.0% | 6.0% | 11.0% |
| CST English-Language Arts Test | |||
| 2010 | 33.0% | 28.0% | 42.0% |
| 2009 | 24.0% | 21.0% | 40.0% |
| 2008 | 34.0% | 29.0% | 37.0% |
| CST U.S. History Test | |||
| 2010 | 26.0% | 20.0% | 45.0% |
| 2009 | 24.0% | 21.0% | 44.0% |
| 2008 | 38.0% | 35.0% | 38.0% |
| CST Chemistry Test | |||
| 2009 | 30.0% | 30.0% | 27.0% |
| 2008 | 14.0% | 14.0% | 25.0% |
End of Course - % of students at or above proficiency
| School | District | State | |
|---|---|---|---|
| CST Algebra I Test | |||
| 2010 | 3.0% | 15.0% | 31.0% |
| 2009 | 4.0% | 5.0% | 28.0% |
| 2008 | 10.0% | 18.0% | 25.0% |
| CST Algebra II Test | |||
| 2010 | 12.0% | 12.0% | 31.0% |
| 2009 | 6.0% | 6.0% | 28.0% |
| 2008 | 9.0% | 9.0% | 27.0% |
| CST Biology Test | |||
| 2010 | 30.0% | 29.0% | 46.0% |
| 2009 | 25.0% | 25.0% | 42.0% |
| 2008 | 46.0% | 46.0% | 42.0% |
| CST Chemistry Test | |||
| 2010 | 33.0% | 33.0% | 38.0% |
| 2009 | 43.0% | 43.0% | 36.0% |
| 2008 | 22.0% | 22.0% | 32.0% |
| CST Earth Science Test | |||
| 2010 | 39.0% | 38.0% | 33.0% |
| CST General Mathematics Test | |||
| 2010 | 23.0% | 32.0% | 27.0% |
| 2009 | 9.0% | 22.0% | 26.0% |
| 2008 | 11.0% | 25.0% | 27.0% |
| CST Geometry Test | |||
| 2010 | 19.0% | 19.0% | 27.0% |
| 2009 | 18.0% | 19.0% | 26.0% |
| 2008 | 11.0% | 16.0% | 24.0% |
| CST World History Test | |||
| 2010 | 24.0% | 21.0% | 41.0% |
| 2009 | 28.0% | 24.0% | 38.0% |
| 2008 | 14.0% | 14.0% | 33.0% |
Source: CA Department of Education 2009-2010
School Map and Similar Schools Nearby
Click to Activate Map of Nearby School Campuses
Private
Public
This School
Similar Schools Nearby
| Mckinleyville High School 9-12 | 660 Students | 29.1 miles away | ![]() 1 out of 5 | |
Compare This School To Nearby Schools ->
School Community Forum

Join a discussion about Hoopa Valley High School and talk to others in the community including students, parents, teachers, and administrators.
Popular Discussion Topics
- Admissions and Registration Questions (e.g. Dress Code and Discipline Policy)
- School Calendar and Upcoming Events (e.g. Graduation)
- After School Programs, Extracurricular Activities, and Athletics (e.g. Football)
- News and Announcements (e.g. Yearbook and Class Supply List Details)
- Graduate and Alumni Events (e.g. Organizing Class Reunions)
Navigation
Can't Find What You Are Looking For?
Rankings
Nearby Cities
Sponsored Links
K-12 Articles
Changing Schools Isn't Easy: Tips for a Successful Transition
It isn't easy for students to make the transition into a new school, especially if they have...
Parent and Family Involvement in School
When visiting my grandson's school, I often hear administrators and teachers complaining that not...
Adolescents, Sleep and Learning
Recently, adolescent's sleep habits have been in the news. Research has shown that adolescents need...


(5 / 5) 