Knightsen Elementary School
Rating
Not Available
Not Available

4 out of 5 | 1 Review
Find Old Friends From Knightsen Elementary School
Use the form below to search for alumni from Knightsen Elementary School.
School Description
School Summary and Highlights
- Enrolls 344 elementary school students from grades KG-8
- Ranks 548th out of 2,050 middle schools in CA.
- 2010 Overall School AYP Met Status: No
Additional Contact Information
- Mailing Address: PO Box 265, Knightsen, CA 94548
School Operational Details
- Title I Eligible
School District Details
- Knightsen Elementary School District
- Per-Pupil Spending: $8,426
- Students Per Teacher: 18.7
- Enrolled Students: 344
Faculty Details and Student Enrollment
Students and Faculty
- Total Students Enrolled: 344
- Total Full Time "Equivalent" Teachers: 18.4
- Average Student-To-Teacher Ratio: 18.7
Students Gender Breakdown
- Males: 170 (49.4%)
- Females: 174 (50.6%)
Free Lunch Student Eligibility Breakdown
- Eligible for Reduced Lunch: 14 (4.1%)
- Eligible for Free Lunch: 90 (26.2%)
- Eligible for Either Reduced or Free Lunch: 104 (30.2%)
Student Enrollment Distribution by Race / Ethnicity
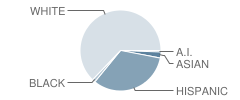
| Number | Percent | |
|---|---|---|
| American Indian | 2 | 0.6% |
| Black | 4 | 1.2% |
| Asian | 8 | 2.3% |
| Hispanic | 110 | 32.0% |
| White | 210 | 61.0% |
Number of Students Per Grade
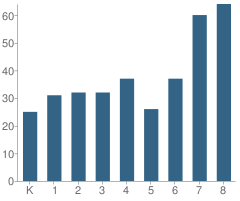
| Number | Percent | |
|---|---|---|
| Kindergarten | 25 | 7.3% |
| 1st Grade | 31 | 9.0% |
| 2nd Grade | 32 | 9.3% |
| 3rd Grade | 32 | 9.3% |
| 4th Grade | 37 | 10.8% |
| 5th Grade | 26 | 7.6% |
| 6th Grade | 37 | 10.8% |
| 7th Grade | 60 | 17.4% |
| 8th Grade | 64 | 18.6% |
Teacher Education Background (2009)
Percent With Master's Degree: 18.5%
Percent With Bachelor's Degree: 3.7%
Teacher Credentials & Experience (2009)
Percent of Teachers With Emergency Credentials: 4.5%
Percent of Teachers With Credentials: 95.5%
Number of Certificated Staff: 27.0
Average Number of Years of Teacher Experience: 9.7
Average Age
School:
41.3
District:
63.0
Source: CA Department of Education, Source: NCES 2009-2010
School Ratings and Reviews
Overall Rating: 4

4 out of 5 | 1 Review
The Overall Rating is the school's average rating from parents, students, school faculty and staff. The highest rating is five apples and the lowest is one apple.
Share Your Review About This School
1 review for Knightsen Elementary School
- Reviewed by Former Student on October 10, 2008
- Rating:
 (4 / 5) Flag as inappropriate
 - knightsen elementary
School Map and Similar Schools Nearby
Click to Activate Map of Nearby School Campuses
Private
Public
This School
Similar Schools Nearby
| Gehringer Elementary School KG-5 | 672 Students | 2.1 miles away |  5 out of 5 | |
| Iron House Elementary School KG-5 | 560 Students | 2.2 miles away | Not Yet Rated | |
| Marsh Creek Elementary School KG-5 | 681 Students | 2.7 miles away | 5 out of 5 | |
| Laurel Elementary School KG-5 | 709 Students | 3.2 miles away | Not Yet Rated | |
| Old River Elementary School KG-8 | 152 Students | 3.2 miles away | Not Yet Rated | - |
| Garin Elementary School KG-5 | 852 Students | 3.2 miles away | Not Yet Rated | |
| Oakley Elementary School KG-5 | 522 Students | 3.5 miles away | Not Yet Rated | |
| Brentwood Elementary School KG-5 | 778 Students | 3.8 miles away | Not Yet Rated | |
| Vintage Parkway Elementary School KG-5 | 534 Students | 4.0 miles away | Not Yet Rated | |
| Pioneer Elementary School KG-5 | 890 Students | 4.2 miles away | 5 out of 5 | |
Compare This School To Nearby Schools ->
School Community Forum

Join a discussion about Knightsen Elementary School and talk to others in the community including students, parents, teachers, and administrators.
Popular Discussion Topics
- Admissions and Registration Questions (e.g. Dress Code and Discipline Policy)
- School Calendar and Upcoming Events (e.g. Graduation)
- After School Programs, Extracurricular Activities, and Athletics (e.g. Football)
- News and Announcements (e.g. Yearbook and Class Supply List Details)
- Graduate and Alumni Events (e.g. Organizing Class Reunions)
Navigation
Can't Find What You Are Looking For?
Rankings
Nearby Cities
Sponsored Links
K-12 Articles

Choosing a Summer Camp for Your Child
Are you planning to send your child to summer camp this year? If so, have you taken his needs into...
Are you planning to send your child to summer camp this year? If so, have you taken his needs into...

Preparing Your Child for the First Day of School
It seems like school was just dismissed for the summer, yet here we are facing another year of back...
It seems like school was just dismissed for the summer, yet here we are facing another year of back...

Teaching Children a Love of History
Parents and grandparents are responsible for teaching children a love of history. To begin, relate...
Parents and grandparents are responsible for teaching children a love of history. To begin, relate...