Scurry-Rosser High School
Rating
Not Available
Not Available

No Reviews Yet
Find Old Friends From Scurry-Rosser High School
Use the form below to search for alumni from Scurry-Rosser High School.
School Description
School Summary and Highlights
- Enrolls 250 high school students from grades 9-12
- Ranks 262nd out of 1,325 high schools in TX.
- 2010 Overall School AYP Met Status: Yes
Additional Contact Information
- Mailing Address: 8321 S State Hwy 34, Scurry, TX 75158
- Principal or Admin: Mr Tim Cook
- Fax: (972) 452-3694
- Website: www.scurry-rosser.com
School District Details
- Scurry-Rosser Independent School District (ISD)
- Per-Pupil Spending: $8,056
- Graduation Rate: 89.7%
- Students Per Teacher: 12.6
- Enrolled Students: 899
Faculty Details and Student Enrollment
Students and Faculty
- Total Students Enrolled: 250
- Total Full Time "Equivalent" Teachers: 25.1
- Average Student-To-Teacher Ratio: 10.0
Students Gender Breakdown
- Males: 136 (54.4%)
- Females: 114 (45.6%)
Free Lunch Student Eligibility Breakdown
- Eligible for Reduced Lunch: 16 (6.4%)
- Eligible for Free Lunch: 68 (27.2%)
- Eligible for Either Reduced or Free Lunch: 84 (33.6%)
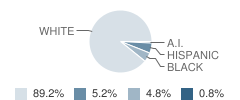
Student Enrollment Distribution by Race / Ethnicity
| Number | Percent | |
|---|---|---|
| American Indian | 2 | 0.8% |
| Black | 12 | 4.8% |
| Asian | - | - |
| Hispanic | 13 | 5.2% |
| White | 223 | 89.2% |
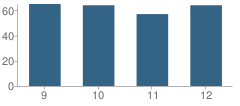
Number of Students Per Grade
| Number | Percent | |
|---|---|---|
| 9th Grade | 65 | 26.0% |
| 10th Grade | 64 | 25.6% |
| 11th Grade | 57 | 22.8% |
| 12th Grade | 64 | 25.6% |
Breakdown of College Ready Graduates (2009)
Percent Ready For College in Reading
School:
78.0%
District:
78.0%
State:
62.0%
Percent Ready For College in Math
School:
62.0%
District:
58.0%
State:
60.0%
Graduation & Dropout Rates (2009)
Graduation Rate
School:
88.1%
District:
88.1%
State:
80.6%
Dropout Rate
School:
6.0%
District:
6.0%
State:
9.4%
Faculty Breakdown (2010)
Average Teacher Experience
School:
8.9
District:
11.0
State:
11.3
Percent of Teachers With 1-5 Years Experience
School:
38.5%
District:
31.3%
State:
31.0%
Percent of Teachers With 6-10 Years Experience
School:
16.3%
District:
18.8%
State:
20.3%
Percent of Teachers With 11-20 Years Experience
School:
32.1%
District:
35.3%
State:
24.4%
Percent of Teachers With Greater Than 20 Years Experience
School:
4.6%
District:
10.1%
State:
18.3%
Faculty Salary (2010)
School Administration Average Base Salary
School:
$59,909
District:
$60,644
State:
$70,209
Teacher Average Base Salary
School:
$43,048
District:
$43,713
State:
$48,263
Beginning Teacher Average Base Salary
School:
$28,032
District:
$30,044
State:
$41,165
Teacher With 1-5 Years Experience Average Base Salary
School:
$37,336
State:
$43,527
Teacher With 6-10 Years Experience Average Base Salary
School:
$45,718
State:
$46,149
Teacher With 11-20 Years Experience Average Base Salary
School:
$50,310
State:
$50,153
Teacher With Greater Than 20 Years Experience Average Base Salary
School:
$58,208
State:
$58,427
Source: TX Department of Education, Source: NCES 2009-2010
School Ratings and Reviews
Be The First To Review Scurry-Rosser High School!
School Map and Similar Schools Nearby
Click to Activate Map of Nearby School Campuses
Private
Public
This School
Similar Schools Nearby
| Norman Jr High School 7-8 | 536 Students | 5.8 miles away | Not Yet Rated | |
| Kaufman High School 9-12 | 965 Students | 5.9 miles away | Not Yet Rated | |
| Crandall High School 9-12 | 736 Students | 8.5 miles away |  1 out of 5 | |
| Kemp Junior High School 7-8 | 237 Students | 10.4 miles away |  5 out of 5 | |
| Kemp High School 9-12 | 498 Students | 11.0 miles away | Not Yet Rated | |
| Seagoville High School 9-12 | 1,118 Students | 16.0 miles away |  4 out of 5 | |
| Ferris Junior High School 7-8 | 379 Students | 16.2 miles away | Not Yet Rated | |
| Forney High School 9-12 | 1,586 Students | 16.8 miles away | 1 out of 5 | |
| High School #2 9-10 | 451 Students | 17.6 miles away | Not Yet Rated | |
| Terrell High School 9-12 | 1,108 Students | 17.8 miles away | 5 out of 5 | |
Compare This School To Nearby Schools ->
School Community Forum

Join a discussion about Scurry-Rosser High School and talk to others in the community including students, parents, teachers, and administrators.
Popular Discussion Topics
- Admissions and Registration Questions (e.g. Dress Code and Discipline Policy)
- School Calendar and Upcoming Events (e.g. Graduation)
- After School Programs, Extracurricular Activities, and Athletics (e.g. Football)
- News and Announcements (e.g. Yearbook and Class Supply List Details)
- Graduate and Alumni Events (e.g. Organizing Class Reunions)
Navigation
Can't Find What You Are Looking For?
Nearby Cities
Sponsored Links
K-12 Articles

Kids and Competition
In the backyard, the classroom, the community and while participating in sports and other...
In the backyard, the classroom, the community and while participating in sports and other...

Keep Morning Stress at a Minimum: Establish a Routine
Morning! It can be a time of stress. The kids are fighting over who gets to use the bathroom first,...
Morning! It can be a time of stress. The kids are fighting over who gets to use the bathroom first,...

Exciting School Lunch Ideas
Earlier this week I had reason to drop by my grandsons' school at lunch time. While waiting for the...
Earlier this week I had reason to drop by my grandsons' school at lunch time. While waiting for the...