Richard H. Lewis Alternative School
Rating
Not Available
Not Available

No Reviews Yet
Find Old Friends From Richard H. Lewis Alternative School
Use the form below to search for alumni from Richard H. Lewis Alternative School.
School Description
School Summary and Highlights
- Enrolls 46 elementary, middle, and high school students from grades KG-12
- 2010 Overall School AYP Met Status: Yes
Additional Contact Information
- Mailing Address: PO Box 5000, Lower Lake, CA 95457
School Operational Details
- Alternative School
School District Details
- Konocti Unified School District
- Per-Pupil Spending: $10,015
- Graduation Rate: 62.7%
- Dropout Rate: 5.2%
- Students Per Teacher: 19.7
- Enrolled Students: 3,099
Faculty Details and Student Enrollment
Students and Faculty
- Total Students Enrolled: 46
- Total Full Time "Equivalent" Teachers: 2.0
- Average Student-To-Teacher Ratio: 23.0
Students Gender Breakdown
- Males: 20 (43.5%)
- Females: 26 (56.5%)
Free Lunch Student Eligibility Breakdown
- Eligible for Reduced Lunch: 2 (4.3%)
- Eligible for Free Lunch: 26 (56.5%)
- Eligible for Either Reduced or Free Lunch: 28 (60.9%)
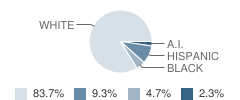
Student Enrollment Distribution by Race / Ethnicity
| Number | Percent | |
|---|---|---|
| American Indian | 1 | 2.2% |
| Black | 2 | 4.3% |
| Asian | - | - |
| Hispanic | 4 | 8.7% |
| White | 36 | 78.3% |
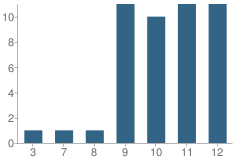
Number of Students Per Grade
| Number | Percent | |
|---|---|---|
| 3rd Grade | 1 | 2.2% |
| 7th Grade | 1 | 2.2% |
| 8th Grade | 1 | 2.2% |
| 9th Grade | 11 | 23.9% |
| 10th Grade | 10 | 21.7% |
| 11th Grade | 11 | 23.9% |
| 12th Grade | 11 | 23.9% |
Teacher Credentials & Experience (2009)
Percent of Teachers With Credentials: 100.0%
Number of Certificated Staff: 2.0
Average Number of Years of Teacher Experience: 24.5
Average Age
School:
58.0
District:
48.9
Source: CA Department of Education, Source: NCES 2009-2010
School Ratings and Reviews
Be The First To Review Richard H. Lewis Alternative School!
School Map and Similar Schools Nearby
Click to Activate Map of Nearby School Campuses
Private
Public
This School
Similar Schools Nearby
| Carle (William C.) High (Continuation) School 9-12 | 103 Students | 0.2 miles away | Not Yet Rated | |
| Highlands High School 9-12 | 46 Students | 1.5 miles away | Not Yet Rated | - |
| Clearlake Community School 7-12 | 20 Students | 1.6 miles away | Not Yet Rated | |
| Middletown Community Day School 7-12 | 7 Students | 10.4 miles away | Not Yet Rated | - |
| Loconoma Valley High School 9-12 | 20 Students | 11.3 miles away | Not Yet Rated | |
| Kelseyville Community Day School 7-12 | 7 Students | 12.7 miles away | Not Yet Rated | - |
| Ed Donaldson Education Center School 9-12 | 21 Students | 13.2 miles away | Not Yet Rated | - |
| Lakeport Alternative (Home School) KG-12 | 37 Students | 19.3 miles away | Not Yet Rated | |
| Buena Vista High School 9-12 | 10 Students | 20.1 miles away | Not Yet Rated | - |
| Renaissance Court School KG-12 | 17 Students | 21.2 miles away | Not Yet Rated | - |
Compare This School To Nearby Schools ->
Navigation
Can't Find What You Are Looking For?
Rankings
Nearby Cities
Sponsored Links
K-12 Articles

The Importance of Ninth Grade
Students who are entering ninth grade do not realize the importance of the critical decisions they...
Students who are entering ninth grade do not realize the importance of the critical decisions they...

Kids and Competition
In the backyard, the classroom, the community and while participating in sports and other...
In the backyard, the classroom, the community and while participating in sports and other...

Helping Young Children with Printing and Cursive Writing
Is your child experiencing difficulty printing or writing? Is he unable to print or write legibly,...
Is your child experiencing difficulty printing or writing? Is he unable to print or write legibly,...