Shamrock Middle School
Rating
Not Available
Not Available

No Reviews Yet
Find Old Friends From Shamrock Middle School
Use the form below to search for alumni from Shamrock Middle School.
School Description
School Summary and Highlights
- Enrolls 58 middle school students from grades 6-8
- Ranks 1212th out of 1,763 middle schools in TX.
- 2010 Overall School AYP Met Status: Yes
Additional Contact Information
- Mailing Address: 100 S Illinois, Shamrock, TX 79079
- Principal or Admin: Mr Tommy Waldrop
- Fax: (806) 256-3628
School Operational Details
- Title I EligibleAll students of this school are eligible for participation in authorized programs.
School District Details
- Shamrock Independent School District (ISD)
- Per-Pupil Spending: $12,954
- Graduation Rate: 58.6%
- Dropout Rate: 3.7%
- Students Per Teacher: 8.4
- Enrolled Students: 322
Faculty Details and Student Enrollment
Students and Faculty
- Total Students Enrolled: 58
- Total Full Time "Equivalent" Teachers: 8.2
- Average Student-To-Teacher Ratio: 7.1
Students Gender Breakdown
- Males: 30 (51.7%)
- Females: 28 (48.3%)
Free Lunch Student Eligibility Breakdown
- Eligible for Reduced Lunch: 5 (8.6%)
- Eligible for Free Lunch: 25 (43.1%)
- Eligible for Either Reduced or Free Lunch: 30 (51.7%)
Student Enrollment Distribution by Race / Ethnicity
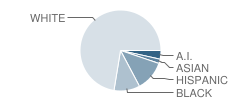
| Number | Percent | |
|---|---|---|
| American Indian | 2 | 3.4% |
| Black | 6 | 10.3% |
| Asian | 1 | 1.7% |
| Hispanic | 7 | 12.1% |
| White | 42 | 72.4% |
Number of Students Per Grade
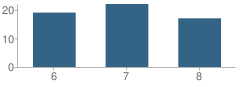
| Number | Percent | |
|---|---|---|
| 6th Grade | 19 | 32.8% |
| 7th Grade | 22 | 37.9% |
| 8th Grade | 17 | 29.3% |
Faculty Breakdown (2010)
Average Teacher Experience
School:
16.7
District:
15.9
State:
11.3
Percent of Teachers With 1-5 Years Experience
School:
29.3%
District:
18.3%
State:
31.0%
Percent of Teachers With 6-10 Years Experience
School:
15.6%
District:
18.0%
State:
20.3%
Percent of Teachers With 11-20 Years Experience
School:
6.3%
District:
23.2%
State:
24.4%
Percent of Teachers With Greater Than 20 Years Experience
School:
48.7%
District:
38.1%
State:
18.3%
Faculty Salary (2010)
School Administration Average Base Salary
School:
$59,500
District:
$59,478
State:
$70,209
Teacher Average Base Salary
School:
$42,841
District:
$43,124
State:
$48,263
Teacher With 1-5 Years Experience Average Base Salary
School:
$31,925
State:
$43,527
Teacher With 6-10 Years Experience Average Base Salary
School:
$39,855
State:
$46,149
Teacher With 11-20 Years Experience Average Base Salary
School:
$53,730
State:
$50,153
Teacher With Greater Than 20 Years Experience Average Base Salary
School:
$48,944
State:
$58,427
Source: TX Department of Education, Source: NCES 2009-2010
School Ratings and Reviews
Be The First To Review Shamrock Middle School!
School Map and Similar Schools Nearby
Click to Activate Map of Nearby School Campuses
Private
Public
This School
Similar Schools Nearby
| Samnorwood School PK-12 | 101 Students | 11.3 miles away | Not Yet Rated | |
| Kelton School PK-10 | 156 Students | 14.9 miles away | Not Yet Rated | |
| Wheeler School PK-12 | 397 Students | 16.4 miles away | Not Yet Rated | |
| Mclean School PK-12 | 220 Students | 20.5 miles away | Not Yet Rated | |
| Wellington Junior High School 6-8 | 120 Students | 25.2 miles away | Not Yet Rated | |
| Fort Elliott School PK-12 | 147 Students | 25.8 miles away | Not Yet Rated | |
Compare This School To Nearby Schools ->
Navigation
Can't Find What You Are Looking For?
Nearby Cities
Sponsored Links
K-12 Articles

Halloween Safety Tips
Ghosts and witches sit beside mistletoe and tinsel on store shelves. Orange and black deck the...
Ghosts and witches sit beside mistletoe and tinsel on store shelves. Orange and black deck the...

Choosing a Summer Camp for Your Child
Are you planning to send your child to summer camp this year? If so, have you taken his needs into...
Are you planning to send your child to summer camp this year? If so, have you taken his needs into...

Help Your High School Student Create an Impressive Resume
Time has flown. Your teen is in high school and has demonstrated an interest in obtaining a part...
Time has flown. Your teen is in high school and has demonstrated an interest in obtaining a part...