Douglass Learning Center School
Rating
Not Available
Not Available

No Reviews Yet
Find Old Friends From Douglass Learning Center School
Use the form below to search for alumni from Douglass Learning Center School.
School Description
School Summary and Highlights
- Enrolls 62 middle and high school students from grades 8-12
- 2010 Overall School AYP Met Status: Yes
Additional Contact Information
- Principal or Admin: Cotton Wade
- Fax: (903) 891-6549
- Website: www.shermanisd.net
School Operational Details
- Alternative School
- Title I EligibleAll students of this school are eligible for participation in authorized programs.
School District Details
- Sherman Independent School District (ISD)
- Per-Pupil Spending: $8,240
- Graduation Rate: 64.6%
- Dropout Rate: 3.5%
- Students Per Teacher: 13.4
- Enrolled Students: 6,714
Faculty Details and Student Enrollment
Students and Faculty
- Total Students Enrolled: 62
- Total Full Time "Equivalent" Teachers: 6.5
- Average Student-To-Teacher Ratio: 9.6
Students Gender Breakdown
- Males: 24 (38.7%)
- Females: 38 (61.3%)
Free Lunch Student Eligibility Breakdown
- Eligible for Reduced Lunch: 6 (9.7%)
- Eligible for Free Lunch: 34 (54.8%)
- Eligible for Either Reduced or Free Lunch: 40 (64.5%)
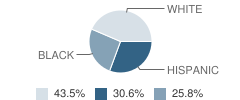
Student Enrollment Distribution by Race / Ethnicity
| Number | Percent | |
|---|---|---|
| American Indian | - | - |
| Black | 16 | 25.8% |
| Asian | - | - |
| Hispanic | 19 | 30.6% |
| White | 27 | 43.5% |
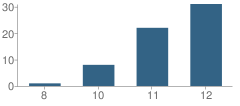
Number of Students Per Grade
| Number | Percent | |
|---|---|---|
| 8th Grade | 1 | 1.6% |
| 10th Grade | 8 | 12.9% |
| 11th Grade | 22 | 35.5% |
| 12th Grade | 31 | 50.0% |
Breakdown of College Ready Graduates (2009)
Percent Ready For College in Reading
School:
50.0%
District:
67.0%
State:
62.0%
Percent Ready For College in Math
School:
27.0%
District:
49.0%
State:
60.0%
Faculty Breakdown (2010)
Average Teacher Experience
School:
18.4
District:
12.1
State:
11.3
Percent of Teachers With 1-5 Years Experience
School:
31.0%
District:
25.1%
State:
31.0%
Percent of Teachers With 11-20 Years Experience
School:
15.5%
District:
28.1%
State:
24.4%
Percent of Teachers With Greater Than 20 Years Experience
School:
53.6%
District:
19.6%
State:
18.3%
Faculty Salary (2010)
School Administration Average Base Salary
School:
$83,311
District:
$72,315
State:
$70,209
Teacher Average Base Salary
School:
$50,083
District:
$46,994
State:
$48,263
Teacher With 1-5 Years Experience Average Base Salary
School:
$42,201
State:
$43,527
Teacher With 11-20 Years Experience Average Base Salary
School:
$47,476
State:
$50,153
Teacher With Greater Than 20 Years Experience Average Base Salary
School:
$55,392
State:
$58,427
Source: TX Department of Education, Source: NCES 2009-2010
School Ratings and Reviews
Be The First To Review Douglass Learning Center School!
School Map and Similar Schools Nearby
Click to Activate Map of Nearby School Campuses
Private
Public
This School
Similar Schools Nearby
| Tri County Juvenile Detent School 6-12 | 8 Students | 0.5 miles away | Not Yet Rated | |
| Cooke / Fannin / Grayson County Juvenile Probation Departments School 6-12 | 49 Students | 0.7 miles away | Not Yet Rated | |
| Pathways High School 9-12 | 16 Students | 7.1 miles away | Not Yet Rated | |
Compare This School To Nearby Schools ->
Navigation
Can't Find What You Are Looking For?
Nearby Cities
Sponsored Links
K-12 Articles

Teachers Packing Heat
After the recent school shootings (and thwarted school shootings) in the past month-just as after...
After the recent school shootings (and thwarted school shootings) in the past month-just as after...

Teaching Kids to Deal with Peer Pressure
Parents usually become very concerned when they hear the term "peer pressure." However, peer...
Parents usually become very concerned when they hear the term "peer pressure." However, peer...

Making Sense of No Child Left Behind
The No Child Left Behind Act of 2001 has met with mixed results and mixed feelings. Some think it...
The No Child Left Behind Act of 2001 has met with mixed results and mixed feelings. Some think it...