Indian Creek Elementary School
Rating
Not Available
Not Available

No Reviews Yet
Find Old Friends From Indian Creek Elementary School
Use the form below to search for alumni from Indian Creek Elementary School.
School Description
School Summary and Highlights
- Enrolls 748 preschool and elementary school students from grades PK-5
- Ranks 2704th out of 4,319 elementary schools in TX.
- 2010 Overall School AYP Met Status: Yes
Additional Contact Information
- Mailing Address: 11914 Dragon Ln, San Antonio, TX 78252
- Principal or Admin: Mr Malcolm Williams
- Fax: (210) 622-4301
- Website: www.swisd.net
School Operational Details
- Title I EligibleAll students of this school are eligible for participation in authorized programs.
School District Details
- Southwest Independent School District (ISD)
- Per-Pupil Spending: $8,042
- Graduation Rate: 69.4%
- Dropout Rate: 5.3%
- Students Per Teacher: 16.3
- Enrolled Students: 11,531
Faculty Details and Student Enrollment
Students and Faculty
- Total Students Enrolled: 748
- Total Full Time "Equivalent" Teachers: 43.2
- Average Student-To-Teacher Ratio: 17.3
Students Gender Breakdown
- Males: 360 (48.1%)
- Females: 388 (51.9%)
Free Lunch Student Eligibility Breakdown
- Eligible for Reduced Lunch: 37 (4.9%)
- Eligible for Free Lunch: 674 (90.1%)
- Eligible for Either Reduced or Free Lunch: 711 (95.1%)
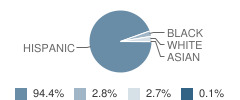
Student Enrollment Distribution by Race / Ethnicity
| Number | Percent | |
|---|---|---|
| American Indian | - | - |
| Black | 21 | 2.8% |
| Asian | 1 | 0.1% |
| Hispanic | 706 | 94.4% |
| White | 20 | 2.7% |
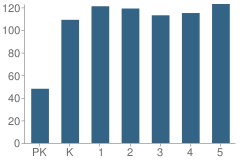
Number of Students Per Grade
| Number | Percent | |
|---|---|---|
| Pre-Kindergarten | 48 | 6.4% |
| Kindergarten | 109 | 14.6% |
| 1st Grade | 121 | 16.2% |
| 2nd Grade | 119 | 15.9% |
| 3rd Grade | 113 | 15.1% |
| 4th Grade | 115 | 15.4% |
| 5th Grade | 123 | 16.4% |
Faculty Breakdown (2010)
Average Teacher Experience
School:
8.9
District:
9.9
State:
11.3
Percent of Teachers With 1-5 Years Experience
School:
44.2%
District:
33.7%
State:
31.0%
Percent of Teachers With 6-10 Years Experience
School:
16.3%
District:
21.5%
State:
20.3%
Percent of Teachers With 11-20 Years Experience
School:
30.2%
District:
26.0%
State:
24.4%
Percent of Teachers With Greater Than 20 Years Experience
School:
7.0%
District:
12.8%
State:
18.3%
Faculty Salary (2010)
School Administration Average Base Salary
School:
$69,015
District:
$74,416
State:
$70,209
Teacher Average Base Salary
School:
$51,284
District:
$52,021
State:
$48,263
Beginning Teacher Average Base Salary
School:
$46,675
District:
$46,698
State:
$41,165
Teacher With 1-5 Years Experience Average Base Salary
School:
$48,303
State:
$43,527
Teacher With 6-10 Years Experience Average Base Salary
School:
$49,956
State:
$46,149
Teacher With 11-20 Years Experience Average Base Salary
School:
$54,993
State:
$50,153
Teacher With Greater Than 20 Years Experience Average Base Salary
School:
$58,725
State:
$58,427
Source: TX Department of Education, Source: NCES 2009-2010
School Ratings and Reviews
Be The First To Review Indian Creek Elementary School!
School Map and Similar Schools Nearby
Click to Activate Map of Nearby School Campuses
Private
Public
This School
Similar Schools Nearby
| Five Palms Elementary School PK-5 | 422 Students | 0.7 miles away | Not Yet Rated | |
| Sky Harbour Elementary School PK-5 | 698 Students | 0.9 miles away | Not Yet Rated | |
| Neil Armstrong Elementary School PK-5 | 483 Students | 0.9 miles away | Not Yet Rated | |
| Hidden Cove Elementary School PK-5 | 603 Students | 1.0 miles away | Not Yet Rated | |
| Frank Madla Elementary School PK-5 | 681 Students | 1.6 miles away | Not Yet Rated | |
| Sun Valley Elementary School PK-5 | 728 Students | 2.0 miles away | Not Yet Rated | |
| Valley Hi Elementary School PK-5 | 389 Students | 2.8 miles away |  5 out of 5 | |
| Lackland Elementary School PK-6 | 681 Students | 2.9 miles away | Not Yet Rated | |
| Lackland City Elementary School PK-5 | 607 Students | 3.1 miles away | Not Yet Rated | |
| Miguel Carrillo Jr Elementary School PK-5 | 530 Students | 3.2 miles away |  3.5 out of 5 | |
Compare This School To Nearby Schools ->
School Community Forum

Join a discussion about Indian Creek Elementary School and talk to others in the community including students, parents, teachers, and administrators.
Popular Discussion Topics
- Admissions and Registration Questions (e.g. Dress Code and Discipline Policy)
- School Calendar and Upcoming Events (e.g. Graduation)
- After School Programs, Extracurricular Activities, and Athletics (e.g. Football)
- News and Announcements (e.g. Yearbook and Class Supply List Details)
- Graduate and Alumni Events (e.g. Organizing Class Reunions)
Navigation
Can't Find What You Are Looking For?
Nearby Cities
Sponsored Links
K-12 Articles

It's the Most Wonderful Time of the Year!
For most of the country, school is starting up this week or later this month-at the beginning of...
For most of the country, school is starting up this week or later this month-at the beginning of...

Parent-Teacher Conference Dos and Don'ts
Finals are over and done, and grades have arrived. Now comes the dreaded time to discuss the...
Finals are over and done, and grades have arrived. Now comes the dreaded time to discuss the...

Feeling Good in Your Own Skin
Body image is a very touchy issue with today's kids. Since the 1950s, when Barbie was first...
Body image is a very touchy issue with today's kids. Since the 1950s, when Barbie was first...