Thorndale High School
Rating
Not Available
Not Available

No Reviews Yet
Find Old Friends From Thorndale High School
Use the form below to search for alumni from Thorndale High School.
School Description
School Summary and Highlights
- Enrolls 200 high school students from grades 9-12
- Ranks 828th out of 1,325 high schools in TX.
- 2010 Overall School AYP Met Status: Yes
Additional Contact Information
- Mailing Address: P O Box 870, Thorndale, TX 76577
- Principal or Admin: Mr Dave Denny
- Fax: (512) 898-5558
- Website: www.thorndale.txed.net
School District Details
- Thorndale Independent School District (ISD)
- Per-Pupil Spending: $8,871
- Graduation Rate: 87.5%
- Students Per Teacher: 10.5
- Enrolled Students: 548
Faculty Details and Student Enrollment
Students and Faculty
- Total Students Enrolled: 200
- Total Full Time "Equivalent" Teachers: 23.4
- Average Student-To-Teacher Ratio: 8.6
Students Gender Breakdown
- Males: 116 (58.0%)
- Females: 84 (42.0%)
Free Lunch Student Eligibility Breakdown
- Eligible for Reduced Lunch: 12 (6.0%)
- Eligible for Free Lunch: 66 (33.0%)
- Eligible for Either Reduced or Free Lunch: 78 (39.0%)
Student Enrollment Distribution by Race / Ethnicity
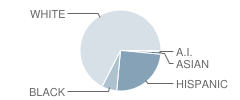
| Number | Percent | |
|---|---|---|
| American Indian | 1 | 0.5% |
| Black | 12 | 6.0% |
| Asian | 2 | 1.0% |
| Hispanic | 50 | 25.0% |
| White | 135 | 67.5% |
Number of Students Per Grade
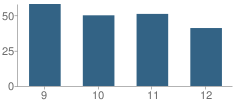
| Number | Percent | |
|---|---|---|
| 9th Grade | 58 | 29.0% |
| 10th Grade | 50 | 25.0% |
| 11th Grade | 51 | 25.5% |
| 12th Grade | 41 | 20.5% |
Breakdown of College Ready Graduates (2009)
Percent Ready For College in Reading
School:
63.0%
District:
63.0%
State:
62.0%
Percent Ready For College in Math
School:
62.0%
State:
60.0%
Graduation & Dropout Rates (2009)
Graduation Rate
School:
88.5%
District:
88.5%
State:
80.6%
Dropout Rate
School:
7.7%
District:
7.7%
State:
9.4%
Faculty Breakdown (2010)
Average Teacher Experience
School:
14.7
District:
14.6
State:
11.3
Percent of Teachers With 1-5 Years Experience
School:
25.7%
District:
19.1%
State:
31.0%
Percent of Teachers With 6-10 Years Experience
School:
10.3%
District:
11.2%
State:
20.3%
Percent of Teachers With 11-20 Years Experience
School:
19.0%
District:
28.7%
State:
24.4%
Percent of Teachers With Greater Than 20 Years Experience
School:
33.5%
District:
35.2%
State:
18.3%
Faculty Salary (2010)
School Administration Average Base Salary
School:
$51,112
District:
$55,237
State:
$70,209
Teacher Average Base Salary
School:
$44,242
District:
$44,182
State:
$48,263
Beginning Teacher Average Base Salary
School:
$31,806
District:
$31,811
State:
$41,165
Teacher With 1-5 Years Experience Average Base Salary
School:
$33,759
State:
$43,527
Teacher With 6-10 Years Experience Average Base Salary
School:
$42,286
State:
$46,149
Teacher With 11-20 Years Experience Average Base Salary
School:
$48,991
State:
$50,153
Teacher With Greater Than 20 Years Experience Average Base Salary
School:
$54,462
State:
$58,427
Source: TX Department of Education, Source: NCES 2009-2010
School Ratings and Reviews
Be The First To Review Thorndale High School!
School Map and Similar Schools Nearby
Click to Activate Map of Nearby School Campuses
Private
Public
This School
Similar Schools Nearby
| Thrall High School 9-12 | 187 Students | 5.6 miles away | Not Yet Rated | |
| Rockdale High School 9-12 | 535 Students | 11.5 miles away | Not Yet Rated | |
| Rockdale Junior High School 6-8 | 398 Students | 11.6 miles away | Not Yet Rated | |
| Taylor High School 9-12 | 896 Students | 12.6 miles away | Not Yet Rated | |
| Granger School PK-12 | 427 Students | 15.4 miles away | Not Yet Rated | |
| Bartlett High School PK-12 | 388 Students | 18.0 miles away | Not Yet Rated | |
| Buckholts School PK-12 | 172 Students | 18.3 miles away | Not Yet Rated | |
| Milano High School 9-12 | 147 Students | 21.2 miles away | Not Yet Rated | |
| Milano Jr High School 6-8 | 91 Students | 21.3 miles away | Not Yet Rated | |
| Rogers High School 9-12 | 260 Students | 21.6 miles away | Not Yet Rated | |
Compare This School To Nearby Schools ->
School Community Forum

Join a discussion about Thorndale High School and talk to others in the community including students, parents, teachers, and administrators.
Popular Discussion Topics
- Admissions and Registration Questions (e.g. Dress Code and Discipline Policy)
- School Calendar and Upcoming Events (e.g. Graduation)
- After School Programs, Extracurricular Activities, and Athletics (e.g. Football)
- News and Announcements (e.g. Yearbook and Class Supply List Details)
- Graduate and Alumni Events (e.g. Organizing Class Reunions)
Navigation
Can't Find What You Are Looking For?
Nearby Cities
Sponsored Links
K-12 Articles

How to Get the Best Supplies for Your Money
School supply lists can seem unending, and the price can add up very quickly. But do we really...
School supply lists can seem unending, and the price can add up very quickly. But do we really...

Parent-Teacher Conference Dos and Don'ts
Finals are over and done, and grades have arrived. Now comes the dreaded time to discuss the...
Finals are over and done, and grades have arrived. Now comes the dreaded time to discuss the...

Is Your Child's Teacher a Bully?
We've all heard about kids being bullied by peers. Kids taunt, tease, pull hair, shove and push...
We've all heard about kids being bullied by peers. Kids taunt, tease, pull hair, shove and push...